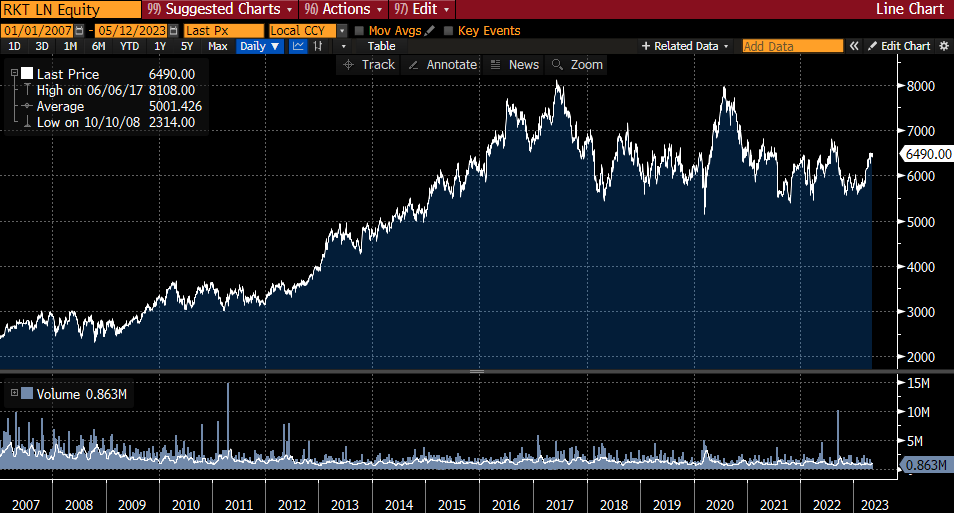
For many years Reckitt was among the bluest of blue chips. Bloomberg data show that its share price rose 478% during the noughties, then by a further 83% during the 2010s. The share price would have its highest ever close at £81.08 on 6 June 2017, but at the close on Friday 12 May 2023 it stood 20% below that at £64.90. What can RKT do to reinvigorate its share price performance?
The investment case on the RKT website states: “Every day, millions of people across the globe put their trust in our market-leading brands. We exist to protect, heal and nurture in the relentless pursuit of a cleaner and healthier world. We fearlessly innovate in this pursuit across our Hygiene, Health and Nutrition businesses”.
Its hygiene brands are all household names – Air Wick, Calgon, Cillit Bang, Finish, Harpic, Lysol, Vanish, Woolite and Mortein.
It’s the same picture in health – Biofreeze, Clearasil, Dettol, Gaviscon, Nurofen, Strepsils, Veet, Mucinex, Durex and KY.
And in nutrition, while Reckitt has had a chequered history in infant formula, the recent surge in demand for its Enfamil and Nutramigen brands show that they have real value.
Between 2007 and 2012 the Group delivered CAGR of 13% in net revenue (from £5.3bn to £9.6bn) and 17% in operating profit (from £1.2bn to £2.6bn). The dividend per share rose at a CAGR of 22% (from 50p to £1.34).
Between 2012 and 2017 the CAGR for each of net revenue (from £9.6bn to £11.4bn); operating profit (from £2.6bn to £3.1bn) and DPS (from £1.34 to £1.643) slowed to 4%.
Between 2017 and 2022 while the CAGR for net revenue marginally increased to 5% (from £11.4bn to £14.5bn); operating profit grew at a CAGR of only 1% (from £3.1bn to £3.2bn) while the DPS increased at a CAGR of only 2% (from £1.643 to £1.833).
It is no surprise that the share price momentum has moderated in tandem with the Group’s financial performance.
Let’s wind the clock back to the share price peak of £81.08 in 2017. That was a transformational year for RKT, which made its largest ever acquisition, buying Mead Johnson Nutrition (MJN) and selling its non-core Food division (best known for French’s mustard).
While acknowledging that hindsight is 20/20, looking back at contemporaneous disclosures around the MJN purchase shows that this was a risky undertaking. The 2017 Annual Report said that: “The acquisition of MJN is on track to exceed our weighted average cost of capital (WACC) by the end of the fifth year of ownership”, which was hardly a compelling financial prognosis.
The acquisition of MJN put £7.7bn of goodwill on the RKT balance sheet at end-2017, which compared to just £3.8bn of goodwill for all of the Group’s other brands at that time.
This proved to be hopelessly optimistic. In FY 2019 a £5bn impairment was taken against MJN, with a further £1bn impairment charge taken in FY 2020. During FY 2021 Reckitt agreed to sell its Chinese infant formula business for an EV of $2.2bn, leaving it with the rights to MJN for the rest of the world. At the end of 2022 the Group had £5.6bn of goodwill for all of its brands, of which £1.6bn relates to IFCN (Infant Formula and Child Nutrition).
Apart from reshaping the brand portfolio, the 2017 transactions also served to transform the balance sheet. On my preferred metric for calculating net debt (which includes leases and pension liabilities), RKT’s closing net debt had averaged £1.8bn in the 10 years to end-2016, with a range of £0.2-2.8bn. By the end of 2017 this had mushroomed to £11.1bn (this is on my measure, RKT’s reported net debt at end-2017 was £10.75bn). The Group has been tipping away at this net debt since then, reducing it to just under £8.0bn on the same basis (for good order, the Group’s measure of net debt shows £7.98bn at end-2022, in-line with how I see it).
Bloomberg consensus has the Group delivering £4.0bn of EBITDA in FY 2023, so with the net debt / EBITDA ratio now back below 2x (and falling), I argue that the balance sheet is in good (and improving) health. Moody’s has RKT rated A3, the seventh highest point in its rating scale (i.e. six notches below AAA). I wouldn’t be surprised to see this rating upgraded as the Group continues to deleverage.
Three events in recent years have shown the strong value of RKT’s brand portfolios.
In 2020 the COVID-19 pandemic saw LFL sales growth of 19.5% in the Hygiene business, catapulting revenues from £5.0bn to £5.8bn. Health revenues jumped 12.1% on the same basis, with reported revenues rising from £4.5bn to £4.9bn. For good order, unsurprisingly there was no COVID ‘bounce’ in Nutrition, where LFL revenues were unchanged (reported £3.3bn).
In 2022 competitor issues led to infant formula shortages, pushing customers to Reckitt’s trusted brands. LFL revenues in Nutrition soared 22.9% last year, helping reported revenues to rise from £2.3bn to £2.5bn.
Also in 2022, against the backdrop of soaring input prices, the Group delivered an adjusted operating margin of 23.8%, which was 210bps higher than the prior year, or 90bps higher excluding the IFCN China business. RKT attributed the 90bps increase to a combination of “strong top line growth, strong productivity and positive mix”. This momentum has carried forward into this year, with the April trading statement (for Q1 2023) stating: “We continue to expect adjusted operating margins to be in line with or slightly above 2022 levels when excluding the one-off benefit of circa 80bps in 2022 related to US Nutrition”. The same (Q1 2023) trading update revealed that LFL net revenue growth was +7.9% y/y in the period, with a 12.4% y/y price/mix tailwind only partly offset by a 4.5% volume decline. That RKT is able to push through price increases of that magnitude is a testament to its brand power.
Where next for Reckitt?
The results page of its IR website contains a useful consensus breakdown of how sell-side analysts viewed the Group’s prospects ahead of the recent (April 2023) trading update.
Significantly, the consensus file points to an acceleration in growth from here, with reported net revenue growth of 2.7% in FY 2023 to be followed by growth of 3.8% in FY 2024 and 4.1% in FY 2025. Over the same period, adjusted operating profits are expected to grow from £3.5bn (a margin of 23.4%) in FY 2023 to £3.9bn (a margin of 24.3%) in FY 2025. Adjusted EPS is expected to grow from 336p in respect of FY 2023 to 394p in respect of FY 2025.
To my mind, these consensus forecasts are well-founded – organic growth should quicken as the global economic outlook improves from the current soft patch; while self-help margin improvement initiatives will enhance profitability.
The same (Q1 2023) consensus file clearly implies that the Group is expected to continue to deleverage at a healthy clip, with the adjusted net finance expense expected to moderate from -£288m in FY 2023 to -£228m in FY 2025.

The steady reduction in leverage opens the door to a resumption of share buybacks. On a fully diluted basis, the Group’s share count reduced from 733m shares in 2012 to 711m in 2017. Since then it has started to tick up again, coming in at 715m for 2022. A falling share count would, all else being equal, create space to accelerate growth in the DPS. Analysts appear to agree with my assumption that a strengthened balance sheet means buybacks will make a return next year – as shown above, the analyst consensus for the share count shows a contraction from 718m (on a fully diluted basis) in FY 2023 to 709m in FY 2025.
Management also hint at buybacks forming a part of RKT’s distributions, with CFO Jeff Carr saying at the time of the FY 2022 results in February that: “As we go forward, we are very clear, we are not going to manage a lazy balance sheet. And as we go forward, opportunities for areas like buybacks will come on the table, because we are certainly entering into that territory. But it was not something we thought was appropriate this year. Having held the dividend for some time, we thought that was the right step to take this year”.
The above sell-side consensus is not particularly heroic. Assumed growth in LFL net revenue over 2023-25 of (say) 3-5% p.a. and margins rising from 23.4% to 24.3% in that timeframe compares to RKT’s guidance for those items of (for LFL net revenue): “To sustainably grow mid-single digit in the medium term”; and (for margins): “Mid-20s adjusted operating profit margin by the mid-2020s”.
Winding back the clock, as I set out earlier, between 2017 and 2022 the CAGR for net revenue was 5% (from £11.4bn to £14.5bn); while operating profit grew at a CAGR of only 1% (from £3.1bn to £3.2bn) and the DPS increased at a CAGR of only 2% (from £1.643 to £1.833). The execution of RKT’s strategic ambition should, in my view, see the operating leverage benefits from net revenue growth augmented by margin expansion generally, with the bottom line (EPS and then, by extension, DPS) further benefitting from (as seems likely) a resumption of buybacks.
If the pre-Q1 analyst consensus of EPS of 394.4p in FY 2025 is met, that puts RKT trading on a prospective 2025 PE multiple of 16.5x. I would argue that this is a very undemanding multiple for a globally significant owner of a portfolio of power brands.
To evidence this, and staying with FY 2025 EPS multiples (based on Bloomberg consensus), Unilever trades on a PE of 16.7x, Haleon on 16.3x, Beiersdorf on 26.7x, Colgate-Palmolive on 21.8x, P&G 22.5x, Estee Lauder 28.1x and L’Oréal 29.8x. A simple average of 23.1x, putting Reckitt trading at a 29% discount to its peer group (and at the second lowest multiple of the same group). I suggest that, with organic growth set to accelerate and the balance sheet strengthening (creating optionality beyond buybacks including M&A), the wide discount that Reckitt trades at compared to many of its fellow mega cap peers is unwarranted.
A number of other factors I’d call out here are: (i) that Reckitt trades on a similar multiple to Haleon is all the more surprising given that c.42% of HLN’s share register is held by Pfizer and GSK, who have indicated their intention to sell off their holdings over time, providing a material technical overhang on the stock; (ii) Bloomberg data going back to 1996 suggest that RKT has traded on an average 1 year forward PE of 21.8x over that period; and (iii) the more eagle-eyed amongst you will have noticed that the UK listed companies are on “16.X” 2025 earnings multiples whereas overseas companies trade at a premium – while RKT does not appear to provide a geographic breakdown of its revenues and earnings, given its global spread of operations it could be argued that it is not really a ‘UK’ company anymore so it may not be wedded to a London listing.
On that last point, the 2022 Annual Report states that only £126m of the £766m of ‘current tax’ for last year relates to UK corporation tax, while only 35% of RKT’s headcount are assigned to Europe/ANZ (c.50% are in Asia and the rest in North America) – it is not fanciful to think that RKT may elect to follow the recent example of other large cap FTSE listed companies and consider a change to its listing arrangements if the market continues to value its portfolio of assets at less than what they would be valued at on another exchange.
All in all, I see RKT as a highly cash generative business, possessing strong brands, with a strengthening balance sheet that provides management with optionality, and which is expected to see an acceleration in organic growth from here. These factors underpin my reason to conclude that I’m a very happy shareholder in RKT.
If you found this blog to be of value, then why not consider subscribing by entering your email address in the box below?

Pingback: Stocks Update 27/10/2023 | Theodosian Capital