Tag Archives: Investment Write-Ups

Prosus (PRX NA) – Buy one, get lots for free

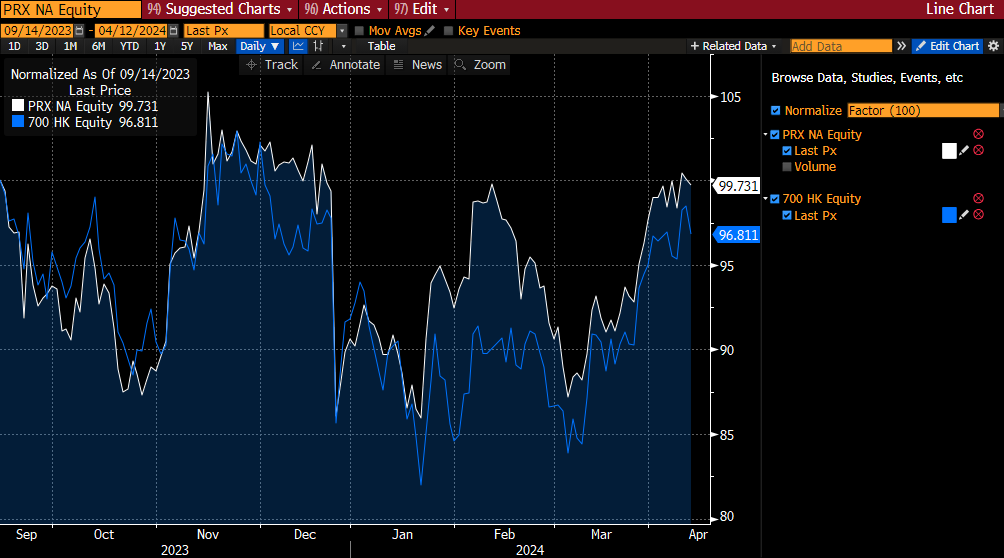
With a market cap of €74bn, Prosus is the largest European listed consumer internet company. It is perhaps best known for its c.25% shareholding in Tencent, currently valued at €86bn. Unsurprisingly, and as shown below, PRX’s share price broadly tracks that of Tencent, with the market likely not affording due consideration to the Group’s other significant assets – it has €8bn of other listed investments and €21bn of unlisted investments. The Group has de minimis (c.€0.02bn) net debt. All in all, this leaves Prosus with a net asset value of €115bn (€46.3 per share) which investors can buy today for €29.4 per share, a 36% discount. Sure, conglomerates generally do trade at a discount, but a number of strategic steps being undertaken by the Group suggest to this shareholder that PRX can narrow this discount – (i) share buybacks; (ii) monetisation of assets; (iii) driving portfolio efficiencies; and (iv) simplification.

Before delving in to the strategic levers that I believe PRX can deliver value for investors from, it is worth spending some time on the Group’s portfolio of assets.

PRX has “more than 80 investments across more than 100 markets“. As mentioned, these span listed and unlisted companies; part and wholly owned and/or controlled. As of 12 April 2024, PRX had €94bn of listed investments, of which c.90% is represented by the shareholding in Tencent, a world-leading internet and technology company. Other meaningful listed holdings include a €3bn stake in Chinese shopping platform Meituan; a €2.5bn stake in the German headquartered food delivery player Delivery Hero; €1.4bn of shares in Singapore travel service conglomerate Trip.com; and smaller (sub-€1bn) shareholdings in online remittance service provider Remitly; Edtech specialist Udemy; US software firm Similarweb; (another Edtech) Skillsoft; (another food delivery firm) Doordash; and social platform VerticalScope.

PRX’s unlisted investments are mainly drawn from the same sectors as the publicly quoted names – Classifieds; Food Delivery; Payments & Fintech; and Edtech. Prosus Ventures is the Group’s VC arm and it has invested $1.4bn in more than 40 high potential firms.

By sector (combining both the private and public assets), 77% of PRX is in Social & Internet Platforms; 8% in Food Delivery; 3% in Classifieds; 4% in Payments & Fintech; 2% in Edtech; 2% in Etail; 2% in Ventures; and 2% in ‘Other Ecommerce’.

As mentioned in the introduction, PRX trades at a discount to the value of its holding in Tencent alone, so in buying Prosus you get exposure to Tencent at a discount and investments in c.80 other businesses for free. Sure, conglomerates generally tend to trade at a discount, but I believe that PRX has a number of levers that should at least narrow this discount. Let’s review these in turn.

(i) Share Buybacks. PRX announced an open-ended share repurchase programme in June 2022, funded by the sale of its shareholding in Tencent. By 30 September 2023, this programme had created over $25bn of value, as 17% of the PRX free float was repurchased at a discount to NAV, leading to 7% NAV accretion per share for continuing shareholders. PRX says that “while the discount remains elevated, we envision no changes to the parameters of the programme”. PRX further notes that its “open-ended buyback program increases our per share exposure to Tencent”. This is an important consideration, given the analyst consensus for Tencent is that it will deliver stronger dividends over the coming years, which will augment the cashflow that PRX is unlocking through its share sales from its investment in the company.

(ii) Monetisation of assets. In PRX’s latest (H1 2024) results, the Group said it would “adopt a more dispassionate approach to portfolio management”. During CY 2023 Prosus exited OLX Autos and sold PayU GPO (for $610m). On the analyst call following the release of the interim results, management was asked to elaborate on its plans to ‘crystallise’ value from its portfolio. The CEO said: “Crystallisation for me is really about highlighting value. And that could happen through a sale, but more likely, in the near to mid-term, through listing businesses. Now, I want to be very clear. Our intent is not to list every single business in our portfolio that’s privately held. Listing is appropriate for businesses when that event can actually help the business, or perhaps there a valuation disconnect between what an asset could be worth in the public markets versus what it’s worth under private ownership“.

(iii) Driving portfolio efficiencies. The end of the ‘zero interest rate environment’ from 2022 onwards has, to my mind, put more discipline on business models generally. We have seen a lot of early stage companies being compelled to accelerate the journey to profitability. Prosus is no exception to this trend. At its Capital Markets Day in December 2022, management set out its plan to achieve profitability from its consolidated Ecommerce portfolio by H1 of FY 2025. This was brought forward to H2 of FY 2024 in the most recent (H1 FY 2024) results, which showed that in the six months to end-September 2023 PRX’s Ecommerce portfolio had consolidated trading losses of $36m, a $220m improvement from the prior year period. The overall PRX portfolio delivered very impressive topline performances, with revenue growth across all divisions (Etail +4% y/y; Edtech +11% y/y; Food Delivery +17% y/y; Classifieds +32% y/y; Payments & Fintech +32% y/y) in H1 2024, and margin improvement in all divisions ranging from 2ppts to 15ppts y/y. The revenue performance is particularly pleasing as it shows the Group isn’t simply trying to ‘cut its way to glory’.

(iv) Simplification. Prosus made its stock market debut in Amsterdam in September 2019, spun out of the South African conglomerate Naspers, as the latter tried to address its valuation discount by listing in a more liquid market with superior capital allocation. Following shareholder approval in September 2023, the cross-holding of shares between Prosus and Naspers was removed, simplifying the corporate structure while maintaining the economic interest split. While this helped to make the PRX story ‘less complicated’, I think there is scope to simplify the narrative further by streamlining the number of verticals that the Group operates across through disposals – put simply, if Prosus becomes less of a conglomerate, then logically it should have less of a conglomerate discount.

Bringing it all together, as a shareholder in Prosus, I see the potential for attractive returns as: (i) loss-making consolidated Ecommerce businesses transition into profitability; (ii) the Group recycles capital from Tencent into buying back its own shares at a discount; and (iii) other (non-Tencent) assets – for which the market currently appears to be attributing a negative value – are divested. I appreciate that (i) and (iii) have a degree of overlap, but given PRX’s sprawling interests and the broad-based uplift in performance across all of its verticals demonstrated in the recent results, I don’t believe that disposals would derail the improving trend in underlying earnings.

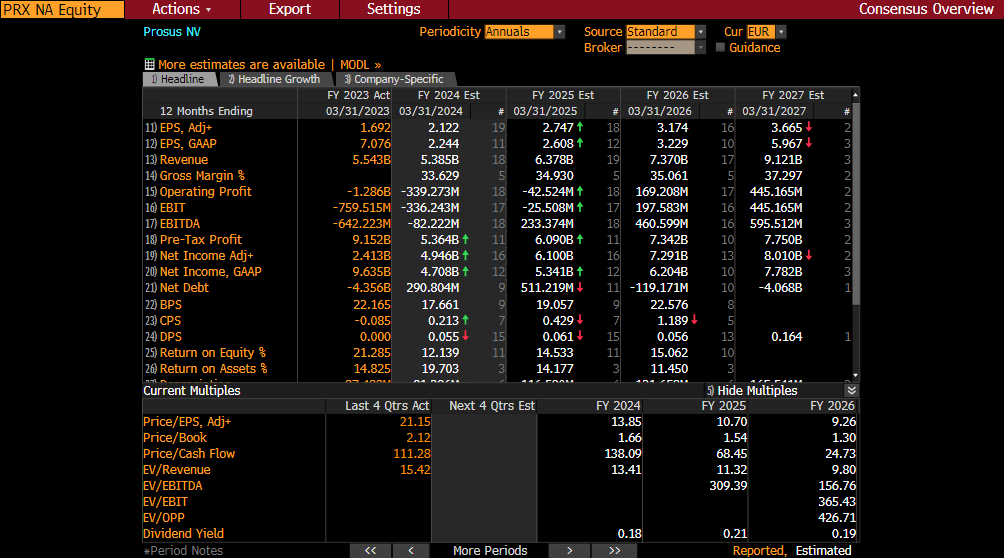
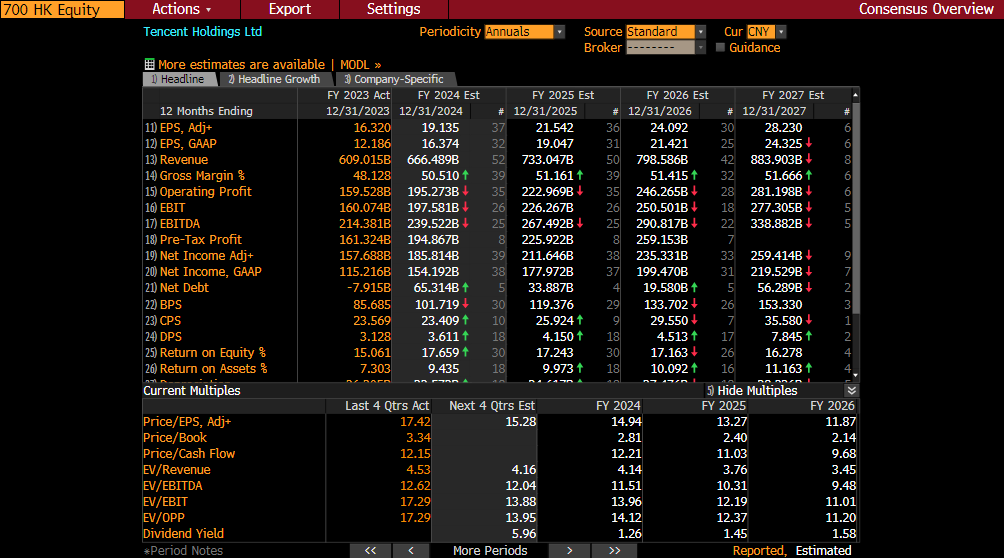
Sell-side consensus, shown here, suggests that analysts (at least) are buying into the same narrative. At a high level, the market expects to see good top-line growth combined with margin expansion that leads to a step change in earnings. Based on this consensus, PRX is very cheap on conventional earnings metrics and the expected strengthening of the balance sheet (rising net cash over the coming years) will likely provide management with considerable optionality around further capital returns. All in all, I remain a very happy shareholder in PRX.

Reckitt (RKT LN) – The power of brands

For many years Reckitt was among the bluest of blue chips. Bloomberg data show that its share price rose 478% during the noughties, then by a further 83% during the 2010s. The share price would have its highest ever close at £81.08 on 6 June 2017, but at the close on Friday 12 May 2023 it stood 20% below that at £64.90. What can RKT do to reinvigorate its share price performance?

The investment case on the RKT website states: “Every day, millions of people across the globe put their trust in our market-leading brands. We exist to protect, heal and nurture in the relentless pursuit of a cleaner and healthier world. We fearlessly innovate in this pursuit across our Hygiene, Health and Nutrition businesses”.

Its hygiene brands are all household names – Air Wick, Calgon, Cillit Bang, Finish, Harpic, Lysol, Vanish, Woolite and Mortein.

It’s the same picture in health – Biofreeze, Clearasil, Dettol, Gaviscon, Nurofen, Strepsils, Veet, Mucinex, Durex and KY.

And in nutrition, while Reckitt has had a chequered history in infant formula, the recent surge in demand for its Enfamil and Nutramigen brands show that they have real value.

Between 2007 and 2012 the Group delivered CAGR of 13% in net revenue (from £5.3bn to £9.6bn) and 17% in operating profit (from £1.2bn to £2.6bn). The dividend per share rose at a CAGR of 22% (from 50p to £1.34).

Between 2012 and 2017 the CAGR for each of net revenue (from £9.6bn to £11.4bn); operating profit (from £2.6bn to £3.1bn) and DPS (from £1.34 to £1.643) slowed to 4%.

Between 2017 and 2022 while the CAGR for net revenue marginally increased to 5% (from £11.4bn to £14.5bn); operating profit grew at a CAGR of only 1% (from £3.1bn to £3.2bn) while the DPS increased at a CAGR of only 2% (from £1.643 to £1.833).

It is no surprise that the share price momentum has moderated in tandem with the Group’s financial performance.

Let’s wind the clock back to the share price peak of £81.08 in 2017. That was a transformational year for RKT, which made its largest ever acquisition, buying Mead Johnson Nutrition (MJN) and selling its non-core Food division (best known for French’s mustard).

While acknowledging that hindsight is 20/20, looking back at contemporaneous disclosures around the MJN purchase shows that this was a risky undertaking. The 2017 Annual Report said that: “The acquisition of MJN is on track to exceed our weighted average cost of capital (WACC) by the end of the fifth year of ownership”, which was hardly a compelling financial prognosis.

The acquisition of MJN put £7.7bn of goodwill on the RKT balance sheet at end-2017, which compared to just £3.8bn of goodwill for all of the Group’s other brands at that time.

This proved to be hopelessly optimistic. In FY 2019 a £5bn impairment was taken against MJN, with a further £1bn impairment charge taken in FY 2020. During FY 2021 Reckitt agreed to sell its Chinese infant formula business for an EV of $2.2bn, leaving it with the rights to MJN for the rest of the world. At the end of 2022 the Group had £5.6bn of goodwill for all of its brands, of which £1.6bn relates to IFCN (Infant Formula and Child Nutrition).

Apart from reshaping the brand portfolio, the 2017 transactions also served to transform the balance sheet. On my preferred metric for calculating net debt (which includes leases and pension liabilities), RKT’s closing net debt had averaged £1.8bn in the 10 years to end-2016, with a range of £0.2-2.8bn. By the end of 2017 this had mushroomed to £11.1bn (this is on my measure, RKT’s reported net debt at end-2017 was £10.75bn). The Group has been tipping away at this net debt since then, reducing it to just under £8.0bn on the same basis (for good order, the Group’s measure of net debt shows £7.98bn at end-2022, in-line with how I see it).

Bloomberg consensus has the Group delivering £4.0bn of EBITDA in FY 2023, so with the net debt / EBITDA ratio now back below 2x (and falling), I argue that the balance sheet is in good (and improving) health. Moody’s has RKT rated A3, the seventh highest point in its rating scale (i.e. six notches below AAA). I wouldn’t be surprised to see this rating upgraded as the Group continues to deleverage.

Three events in recent years have shown the strong value of RKT’s brand portfolios.

In 2020 the COVID-19 pandemic saw LFL sales growth of 19.5% in the Hygiene business, catapulting revenues from £5.0bn to £5.8bn. Health revenues jumped 12.1% on the same basis, with reported revenues rising from £4.5bn to £4.9bn. For good order, unsurprisingly there was no COVID ‘bounce’ in Nutrition, where LFL revenues were unchanged (reported £3.3bn).

In 2022 competitor issues led to infant formula shortages, pushing customers to Reckitt’s trusted brands. LFL revenues in Nutrition soared 22.9% last year, helping reported revenues to rise from £2.3bn to £2.5bn.

Also in 2022, against the backdrop of soaring input prices, the Group delivered an adjusted operating margin of 23.8%, which was 210bps higher than the prior year, or 90bps higher excluding the IFCN China business. RKT attributed the 90bps increase to a combination of “strong top line growth, strong productivity and positive mix”. This momentum has carried forward into this year, with the April trading statement (for Q1 2023) stating: “We continue to expect adjusted operating margins to be in line with or slightly above 2022 levels when excluding the one-off benefit of circa 80bps in 2022 related to US Nutrition”. The same (Q1 2023) trading update revealed that LFL net revenue growth was +7.9% y/y in the period, with a 12.4% y/y price/mix tailwind only partly offset by a 4.5% volume decline. That RKT is able to push through price increases of that magnitude is a testament to its brand power.

Where next for Reckitt?

The results page of its IR website contains a useful consensus breakdown of how sell-side analysts viewed the Group’s prospects ahead of the recent (April 2023) trading update.

Significantly, the consensus file points to an acceleration in growth from here, with reported net revenue growth of 2.7% in FY 2023 to be followed by growth of 3.8% in FY 2024 and 4.1% in FY 2025. Over the same period, adjusted operating profits are expected to grow from £3.5bn (a margin of 23.4%) in FY 2023 to £3.9bn (a margin of 24.3%) in FY 2025. Adjusted EPS is expected to grow from 336p in respect of FY 2023 to 394p in respect of FY 2025.

To my mind, these consensus forecasts are well-founded – organic growth should quicken as the global economic outlook improves from the current soft patch; while self-help margin improvement initiatives will enhance profitability.

The same (Q1 2023) consensus file clearly implies that the Group is expected to continue to deleverage at a healthy clip, with the adjusted net finance expense expected to moderate from -£288m in FY 2023 to -£228m in FY 2025.

The steady reduction in leverage opens the door to a resumption of share buybacks. On a fully diluted basis, the Group’s share count reduced from 733m shares in 2012 to 711m in 2017. Since then it has started to tick up again, coming in at 715m for 2022.  A falling share count would, all else being equal, create space to accelerate growth in the DPS. Analysts appear to agree with my assumption that a strengthened balance sheet means buybacks will make a return next year – as shown above, the analyst consensus for the share count shows a contraction from 718m (on a fully diluted basis) in FY 2023 to 709m in FY 2025.

Management also hint at buybacks forming a part of RKT’s distributions, with CFO Jeff Carr saying at the time of the FY 2022 results in February that: “As we go forward, we are very clear, we are not going to manage a lazy balance sheet. And as we go forward, opportunities for areas like buybacks will come on the table, because we are certainly entering into that territory. But it was not something we thought was appropriate this year. Having held the dividend for some time, we thought that was the right step to take this year”.

The above sell-side consensus is not particularly heroic. Assumed growth in LFL net revenue over 2023-25 of (say) 3-5% p.a. and margins rising from 23.4% to 24.3% in that timeframe compares to RKT’s guidance for those items of (for LFL net revenue): “To sustainably grow mid-single digit in the medium term”; and (for margins): “Mid-20s adjusted operating profit margin by the mid-2020s”.

Winding back the clock, as I set out earlier, between 2017 and 2022 the CAGR for net revenue was 5% (from £11.4bn to £14.5bn); while operating profit grew at a CAGR of only 1% (from £3.1bn to £3.2bn) and the DPS increased at a CAGR of only 2% (from £1.643 to £1.833). The execution of RKT’s strategic ambition should, in my view, see the operating leverage benefits from net revenue growth augmented by margin expansion generally, with the bottom line (EPS and then, by extension, DPS) further benefitting from (as seems likely) a resumption of buybacks.

If the pre-Q1 analyst consensus of EPS of 394.4p in FY 2025 is met, that puts RKT trading on a prospective 2025 PE multiple of 16.5x. I would argue that this is a very undemanding multiple for a globally significant owner of a portfolio of power brands.

To evidence this, and staying with FY 2025 EPS multiples (based on Bloomberg consensus), Unilever trades on a PE of 16.7x, Haleon on 16.3x, Beiersdorf on 26.7x, Colgate-Palmolive on 21.8x, P&G 22.5x, Estee Lauder 28.1x and L’Oréal 29.8x. A simple average of 23.1x, putting Reckitt trading at a 29% discount to its peer group (and at the second lowest multiple of the same group). I suggest that, with organic growth set to accelerate and the balance sheet strengthening (creating optionality beyond buybacks including M&A), the wide discount that Reckitt trades at compared to many of its fellow mega cap peers is unwarranted.

A number of other factors I’d call out here are: (i) that Reckitt trades on a similar multiple to Haleon is all the more surprising given that c.42% of HLN’s share register is held by Pfizer and GSK, who have indicated their intention to sell off their holdings over time, providing a material technical overhang on the stock; (ii) Bloomberg data going back to 1996 suggest that RKT has traded on an average 1 year forward PE of 21.8x over that period; and (iii) the more eagle-eyed amongst you will have noticed that the UK listed companies are on “16.X” 2025 earnings multiples whereas overseas companies trade at a premium – while RKT does not appear to provide a geographic breakdown of its revenues and earnings, given its global spread of operations it could be argued that it is not really a ‘UK’ company anymore so it may not be wedded to a London listing.

On that last point, the 2022 Annual Report states that only £126m of the £766m of ‘current tax’ for last year relates to UK corporation tax, while only 35% of RKT’s headcount are assigned to Europe/ANZ (c.50% are in Asia and the rest in North America) – it is not fanciful to think that RKT may elect to follow the recent example of other large cap FTSE listed companies and consider a change to its listing arrangements if the market continues to value its portfolio of assets at less than what they would be valued at on another exchange.

All in all, I see RKT as a highly cash generative business, possessing strong brands, with a strengthening balance sheet that provides management with optionality, and which is expected to see an acceleration in organic growth from here. These factors underpin my reason to conclude that I’m a very happy shareholder in RKT.

If you found this blog to be of value, then why not consider subscribing by entering your email address in the box below?

GSK (GSK LN) – A prescription for growth?

2022 was a landmark year for GSK, with the Group completing the demerger of its Consumer Healthcare business (Haleon). The IPO of HLN was almost derailed by a takeover approach by Unilever, which indicated a willingness to pay up to £50bn for HLN. It is not clear that ULVR shareholders would have supported a bid at that level, but I suspect many GSK shareholders (including this one) would have happily sold there – on 18 July HLN started trading at £3.30 a share, giving a market cap of £30.5bn – and adding in net debt of £10.7bn on that date gives HLN a starting enterprise value of £41.2bn, 18% below the indicative ULVR offer (the variance likely reflects a change of control premium and/or the synergies that ULVR would have extracted from HLN. My more detailed thoughts on HLN are available here.

The demerger of the Consumer Healthcare business has made GSK a more focused Group, concentrating on vaccines and medicines.

In FY 2021 GSK (including the now-Haleon) reported sales of £34bn and adjusted operating profit of £8.8bn. Excluding Consumer Healthcare, the continuing GSK business contributed £24.5bn of revenue and £6.6bn of adjusted operating profit. It should be noted that of the £24.5bn of revenues, £1.4bn of this related to COVID-19 solutions.

In June 2021 management gave a presentation on ‘New GSK’ (i.e. GSK minus Consumer Healthcare). This set out an ambition for CAGR of more than 5% sales and 10% adjusted operating profit over the 2021-26 period. Taking the actual FY 2021 performance and adjusting for Consumer Healthcare as the starting point (i.e. revenue of £24.5bn and adjusted operating profit of £6.6bn), this gets to 2026 sales and adjusted operating profit of £31.3bn and £10.6bn respectively.

The market appears to concur with this guidance, with consensus for 2025 settling at revenues of £32.8bn and headline (pre-adjustments) operating profit of £9.8bn. As discussed later in this piece, GSK has made a number of acquisitions recently, which likely explains some of the (positive) variance between sell-side expectations for 2025 and management’s own guidance for 2026.

GSK released its first set of results (for Q322) post the HLN demerger at the start of November. These showed broad improvement in the top-line across all divisions, with Specialty Medicines revenue of £2.7bn +24% at constant FX rates; General Medicines revenue of £2.6bn +1% at constant currency; and Vaccines revenue of £2.5bn +5% on the same basis. It should be noted that the £7.8bn of reported revenue benefitted from a currency tailwind of £0.6bn and pandemic-related revenue of £0.2bn, nonetheless, excluding both of these items shows underlying revenue of £7.0bn in the quarter, +7% at constant FX rates versus the same period in the prior year.

Year to date (to end-Q322) revenue of £21.9bn and adjusted EPS of 113.9p were +19% and +20% respectively. Management again raised its FY guidance at the Q3 results to sales growth of 8-10%; adjusted operating profit growth of 15-17%; and adjusted EPS growth c.1% below the rate of adjusted operating profit growth (i.e. 14-16%). At the time of the Q2 results management had guided to sales growth of 6-8% and adjusted operating profit growth of 13-15%, with the same delta in EPS growth as in the refreshed guidance. It is encouraging to see the pace of growth in both the top-line and adjusted operating profits tracking above the guidance set by management out to 2026.

There are two key growth avenues for GSK, R&D and ‘strategic business development’ (M&A and partnerships). On the latter, GSK completed two significant acquisitions in the second half of 2022. The Group bought Affinivax, a clinical-stage biopharmaceutical company focused on pneumococcal vaccine candidates, for an initial £1.8bn (up to a further £1.0bn is payable, conditional on the achievement of clinical development milestones); and Sierra Oncology, a late-stage biopharmaceutical company focused on targeted therapies for the treatment of rare forms of cancer, for £1.6bn. In addition, GSK signed a licence agreement with Spero Therapeutics to give it “exclusive access to tebipenem HBr, a late-stage antibiotic that may treat complicated urinary tract infections”.

There has been a lot of focus on GSK’s R&D pipeline. A May 2020 article in the FT (‘Drug Wars: How AstraZeneca overtook GSK in UK pharma’) noted that: “AstraZeneca’s success has put GSK under even more pressure to demonstrate that it can pull off a similarly durable R&D-led revival after years of failing to develop a cadre of new blockbuster medicines, despite a healthy number of regulatory approvals”. GSK’s innovation focus is on four therapeutic areas – Infectious Diseases; HIV; Immunology/Respiratory; and Oncology. At the end of September GSK had a pipeline of 65 potential new vaccines and medicines across Phase I; Phase II; and Phase III/Registration.

The Group has been stepping up its investment in R&D in recent years. The Group expensed £4.6bn (equivalent to 13.5% of that year’s revenue) on R&D in 2019; £5.1bn (15.0% of revenue) in 2020; and £5.3bn (15.5% of revenue) in 2021. The combined £15bn of R&D spend over those three years is equivalent to around a quarter of GSK’s market cap, hinting that the market is likely not betting big on the pipeline. GSK’s Q322 results show a year to date R&D spend of £3.7bn, up from £3.6bn in the same period in 2021.

I won’t pretend to be an expert on the science, but I do draw reassurance from the volume of recent updates regarding the pipeline in Q422 and also the steady uptick in R&D spend in recent years.

One particular highlight was October’s announcement of Phase III trial results for GSK’s RSV vaccine candidate. These found a 94.1% reduction in severe RSV disease and overall vaccine efficacy of 82.6%, with a favourable safety profile. While Pfizer also has a promising RSV vaccine candidate (for good order, Moderna is due to release the first interim analysis from its Phase III RSV vaccine study in the near term), the fact that RSV did not have a vaccine before now suggests that the addressable market will be more than big enough for a number of players to compete in – RSV causes over 420,000 hospitalisations each year and 29,000 deaths in adults in industrialised countries. GSK has made regulatory submissions in respect of its RSV vaccine in Japan, the EU and USA.

Other R&D highlights in Q4 include: (i) Sanofi and GSK’s next-generation COVID-19 booster vaccine VidPrevtyn Beta being approved by the European Commission; (ii) the European Medicines Agency accepting marketing authorisation application for momelotinib for the treatment of myelofibrosis (a rare blood cancer); (iii) the Jemperli (dostarlimab) RUBY phase III trial meeting its primary endpoint in a planned interim analysis in patients with primary advanced or recurrent endometrial cancer – regulatory submissions based on the trial results are planned for H123; and (iv) while GSK initiated the process for withdrawal of US marketing authorisation for Blenrep on foot of a US FDA request, additional trials are planned to determine the potential benefit of its use in combination with other treatments for multiple myeloma (a more common type of blood cancer).

One issue that weighed on the share price for a large part of 2022 was litigation risk around a previously owned drug (Zantac). December saw a significant ruling in the federal Multi-District Litigation in the US, where the court sided with the scientific consensus, which is that there is no consistent or reliable evidence that ranitidine increases the risk of any cancer. This doesn’t draw a firm line under the Zantac matter – there is the possibility of an appeal of this ruling, while other cases are being taken at the State level – but the 7.5% one-day jump in the share price that followed the ruling (adding £4bn to GSK’s market cap) indicates that the market believes the risks from Zantac are reducing.

Let’s turn to the GSK balance sheet. The Group had £60bn of assets at end-September, of which ‘Other Intangibles’ (intellectual property) were £16bn; PPE £9bn; Goodwill £7bn; and ‘Current Equity Investments’ (Haleon) £3.5bn. It should be noted that the Haleon stake isn’t entirely ‘free funds’ for GSK – the Group has a direct interest (worth c.£1.6bn at the current HLN share price) while a further c.£2.3bn of HLN stock sits in Scottish Limited Partnerships tied to GSK’s pension schemes. However, the fact that the current HLN stake value is higher than the latest book value is a positive, although mark-to-market moves are going to inject some unhelpful ‘noise’ in GSK results reporting so long as it remains on the HLN register. Another point of note on the asset side of the balance sheet is that GSK is currently marketing its ‘old’ HQ in West London for sale – it’s a 690,000 sq ft building that I’ve previously estimated could be worth around £345m (granted, this isn’t a good time to be trying to shift a jumbo commercial real estate asset in the UK) – ahead of the Group’s move to much smaller (140,000 sq ft) rented accommodation in central London.

On the liability side of the balance sheet, I note that the end-September on-balance sheet pension deficit was £2.9bn. Post the balance sheet date, and in response to market volatility in UK gilts in October, the Group injected £334m in voluntary cash contributions to two of its DB schemes. The Group had net debt of £18.4bn at end-September, down £1.4bn from end-2021, and this is an undemanding 2.0x multiple of the £9.2bn sell-side consensus EBITDA forecast for FY22. 

Turning to distributions, at the June 2021 ‘New GSK’ investor update management set out that, from 2022, a progressive dividend policy would be implemented, guided by a 40-60% payout ratio throughout the investment cycle. Adjusting for last year’s share consolidation, management now guides to an expected dividend for 2023 of 56.5p. This equates to a yield of 3.9% at the current share price. Given management’s medium-term growth ambitions, this dividend is likely to increase steadily from here.

Bloomberg consensus, shown here, assumes that GSK will deliver revenue of £32.8bn in 2025 and headline operating profit of £9.8bn in the same year, suggesting that management’s medium-term guidance (to 2026) is reasonable. Beyond that, there is a material threat to GSK sales and earnings, with the loss of exclusivity for Dolutegravir kicking in. GSK’s family of Dolutegravir medicines contributed £4.6bn of revenue in FY21, or about 19% of that year’s total, excluding Consumer Healthcare.

In my view, management isn’t over-promising when it comes to the risks from the loss of exclusivity on Dolutegravir. The New GSK presentation guides to £33bn of revenue in 2031, while it also guides to CAGR in sales of 5% over 2021-26, which gets you to about £31bn of revenues of 2026. So, in real (inflation adjusted) terms, the GSK guidance assumes flat revenue between 2026 and 2031. This might sound unexciting to readers, but with operating margin guidance of >30%, this still implies that GSK will do c.£10bn of adjusted operating profit a year over the period.

To this end, it is worth noting that as 40-60% of earnings will be distributed out to shareholders, looking at the R&D pipeline (65 medicines and vaccines at end-September 2022), I wouldn’t bet against management being able to create more value with the other (say) 40-60% of earnings in the period.

GSK trades on a very undemanding multiple of just 9.8x expected earnings. This suggests to me that very little is being priced in by the market in terms of its growth prospects. Indeed, GSK is only trading in-line with the broader UK market and at a discount to large cap pharma peers – Koyfin data show that AstraZeneca is on 19.6x forward PE; Sanofi on 10.8x; and Pfizer is also on 10.8x.

What will it take for GSK to trade in line with the peer group? I think the market is saying ‘show me’ in terms of the GSK pipeline. Further successes here will be the catalyst for a re-rating in my view. In the meantime, the discount at which GSK trades at relative to peers suggests limited downside risk to me here. I like GSK here and am a happy holder.

If you found this blog to be of interest, then why not subscribe by entering your details in the box below?

Rheinmetall (RHM GY) – Defence, not defensive

Lenin once said that: “There are decades where nothing happens; and there are weeks where decades happen”. On 24 February last, the commencement of the Russian invasion of the parts of Ukraine it didn’t already illegally occupy fundamentally transformed the Western security picture. The previous ‘Wandel durch Handel’ (change through trade) approach of dealing with authoritarian regimes, associated with the likes of Angela Merkel, had been seen as bestowing a ‘Friedensdividende‘ (peace dividend) to Western governments. Structurally lower defence spending was the reward for a perceived threat reduction.

As a result, many Western countries went into 2022 with antiquated platforms. By way of illustration, as of July five EU member states were still operating Soviet era fighter jets – Bulgaria (Mig-29, Su-25); Croatia (Mig-21); Poland (Mig-29, Su-22); Romania (Mig-21); and Slovakia (Mig-29). While Ukraine had made strides in modernising aspects of its military, most notably in terms of tactics, the backbone of its equipment was still based on Soviet platforms come the start of the 2022 invasion. Western countries, particularly those in Eastern Europe, rushed stockpiles of Soviet era equipment to help Ukraine defend itself against the aggressor.

The effectiveness of this effort is clear. As of 12 November, the Ukrainian Armed Forces had liberated around 75,000 sq km of the territory seized by Russia after 24 February, or c.63% of the total. The attrition of Russian equipment by the defenders has been astonishing. While the fog of war makes it difficult to quantify the exact damage inflicted on the invader, that fact that Russia has rushed 1970s missiles (Kh-55s); 1960s era tanks (T-62); 1950s era armoured cars (MT-LBs); and 1940s era anti-aircraft guns (S-60s) suggests that its quartermasters are digging around the back of the warehouses to sustain operations.

Ukraine has also, plainly, incurred severe losses. But deliveries of Soviet era kit from Western countries have been augmented by more modern systems, particularly ‘shoot and scoot’ systems like HIMARS which allow Ukraine to deplete Russian positions from afar. But, as the war has dragged on, inventory shortages have begun to impact.

One particular choke point for both sides is artillery. The Financial Times reported on 14 December that: “Russian forces have fired 10mn artillery rounds from its stock of 17mn shells at the start of the year”. On 2 December the same paper said: “During intense fighting in the eastern Donbas region this summer, Russia used more ammunition in two days than the British military has in stock. Under Ukrainian rates of artillery consumption, British stockpiles might last a week and the UK’s European allies are in no better position”.

While the resolution of the Ukraine war has yet to become clear, I see three lasting consequences for defence contractors.

Firstly, Western countries will structurally increase their defence spending, reversing some of the Friedensdividende. NATO countries’ GDP runs to more than $40trn, so every 25bps increase in spend as a % of GDP implies an extra $100bn+ annual outlay (and NATO’s guideline is for more than 20% of spend to go on equipment; in practice most members spend a far higher share on kit).

Secondly, there will need to be an element of catch-up spend to replenish inventories that have been run down to support the Ukrainian war effort.

Thirdly, the global export market is likely to be dominated by Western firms for many years to come, as: (i) Russia will presumably divert its own production to rebuild its shattered military; and (ii) The woeful performance of Russian systems in combat against comparable Western equipment will not have escaped the attention of officials tasked with procurement in third countries.

These three factors lead me to be very bullish on Western defence firms generally.

Within the Western sphere I’m particularly interested in European suppliers. The reason for this is that Europe has more ‘catching up’ to do on spend than the US. A June 2022 NATO communique estimated that this year’s defence spend across the bloc would be $1.1trn in 2015 dollars, split $723bn for the US and $328bn for Europe and Canada.

One leading European player is Rheinmetall. It has a rich heritage, having been founded in 1889, and a proven track record of innovation in products and services. It has two core verticals, security and automotive, although the indications are that the latter will be a less important part of the Group going forward. Rheinmetall employs 25,000 people and has 133 locations and production sites worldwide.

What I like about its security offering is that it has a huge range of products that can meet many requirements of the Western rearmament programme – armoured cars; tanks; transport vehicles; self-propelled howitzers; special forces vehicles; recovery vehicles; engineering vehicles; drones; ammunition; turret systems; air defence systems; sensors; observation and fire control units; laser systems; and a variety of support services (simulation and training; fleet management). In automotive RHM’s offerings span pistons, pumps, castings and valves.

OK, that’s the theory, but what is RHM’s track record like?

In 2011 RHM reported sales of €4.5bn; EBITDA of €538m; Operating Cash Flow of €290m; ROCE of 14.9%; EPS of €5.55 and DPS of €1.80. That year it had FD shares out of 38.33m. The order backlog at year end was €4.95bn.

In 2021 RHM sales were €5.7bn (a CAGR of 2% since 2011); EBITDA was €859m (a CAGR of 5% in the same period); ROCE was a strong 19.0%; EPS was €6.72 (CAGR of 2% since 2011); DPS was €3.30 (CAGR of 6%); and Operating Cash Flow was €690m (CAGR of 9%). FD shares out at end-2021 of 43.28m meant that the share count has grown at a CAGR of just 1% since 2011. Perhaps most significantly, the order backlog at end-2021 of €13.93bn has grown at a CAGR of 11% since 2011.

The huge order backlog provides considerable income visibility into the medium term and, for the reasons set out above, there is every reason to believe that this will remain the case for years to come. Indeed, RHM’s Q3 2022 results, released in November, saw management reaffirm guidance for 2022 of organic sales growth of c.15%.

Rheinmetall’s share price started 2022 at €83.06, but soared to €227.90 in the wake of the Ukraine war, reflecting the changed reality for Western defence spend. They subsequently slipped back a little, and I added it to my portfolio at €152.35 (inclusive of charges) on 17 October. The stock has since increased to €201.40 as of the close on 16 December.

Despite this strong share price performance, the shares trade on an undemanding earnings multiple of 16.1x on a next 12 months basis, per Koyfin data. Yes, this is towards the high end of the range it has traded at over the past 20 years, but I would highlight that, for most of that period, Friedensdividende would have been the prevailing thought that would come to mind if considering the outlook for Rheinmetall and its European peers.

Sell-side consensus sees earnings growing from 2021’s €6.72 to €19.645 in 2025 – an astonishing CAGR of 31% (which compares to the CAGR of 2% in the 10 years to 2021!). A 16.1x forward earnings multiple looks extremely undemanding when set against that forecast growth profile.

Is this growth profile realistic? On 16 November Rheinmetall held a Capital Markets Day (CMD) titled: “Supercycle 2.0”. Management outlined its expectation for “accelerated growth in all end markets”, supported by rising NATO spend generally and the addition of new members Finland and Sweden. In RHM’s home market, the German government has committed to spending €100bn on new military equipment while raising annual defence spend by €50bn. In automotive, RHM sees opportunities in electrification and emissions reduction.

RHM is also focused on portfolio management, exiting non-core businesses and expanding in structural growth areas (including in automation, digitisation and electrification). A good example of this portfolio management is the proposed €1.2bn acquisition of shell producer Expal in Spain. For Germany alone to reach its target inventory of shells that would consume 10 years of [inadequate] existing industry capacity. Given that capacity upscale is slow and expensive, the “smartest move is to load available idle capacities”. Expal more than doubles RHM’s capacity in rounds, while Expal is currently only operating at around 50% of capacity.

Returning to the forecast near-trebling in earnings between 2021 and 2025, it is worth noting that the RHM CMD assumes revenue growth from €5.7bn to €10-11bn over that timeframe, with EBIT margins widening from 10.5% to c.13.0% in the period. That guidance, presumably informed by the order backlog I mentioned above, gives me confidence in sell-side earnings forecasts. Another factor that gives me confidence is the guided step-up in capex to support this growth – having invested €277m in 2020 and €242 in 2021, RHM is guiding investment of €400m, €600m, €450m and €450m in 2022/23/24/25. Capex of well below 1x annual EBITDA seems eminently realistic to me.

Apart from (presumably) share price growth, shareholders will share in the higher earnings, with the Group guiding a payout ratio of 35-40% in the mid-term and flagging the possibility of buybacks (the latter is “currently not a priority”).

For me, I see RHM as an inexpensive play on the structural growth story in Western defence markets. As an aside, while I appreciate that ESG considerations will be a turn-off for many investors, the lesson from the Russian army’s cruelty in Ukraine is that security investment is a must-have.

If you wish to be notified of updates to this blog, then why not consider subscribing using the form below?

Greencoat Renewables (GRP ID) – Turning green into gold

The admission document accompanying Greencoat Renewables’ listing in July 2017 states that “the company has been established by the Investment Manager to give investors exposure to operational renewable energy infrastructure assets denominated in euro. The Board and the Investment Manager believe there is a significant opportunity to consolidate ownership of operational wind farms in Ireland over the short to medium term and, in due course, to diversify its portfolio through acquisitions of further renewable energy infrastructure assets in Other Relevant Countries”.

Cashflow and resultant distributions would be a central plank of the investment case. From the same document: “Over a long term horizon, the Company’s aim is to provide investors with an annual dividend per Ordinary Share that increases progressively while growing the capital value of its investment portfolio. The Company is targeting an annualised dividend of €0.06 per Ordinary Share from Admission”.

The admission price was €1.00, so a strong initial annualised dividend yield of 6.00% (off the IPO price) was targeted. The Group raised €264.6m in net proceeds from the IPO, which gave the Group a share count of 270m shares on admission. Reflecting buoyant investor demand for renewable assets, the Group has conducted several follow-on capital raises at attractive (>NAV) levels, which mean that while the share count has climbed to 1.1bn shares, the NAV per share has grown to 110.1c (as at end-September 2022) notwithstanding the €166.5m paid out in dividends from admission to end-June 2022. The per-share dividend has grown too – GRP is targeting a dividend payout of 6.18c/share in the current financial year.

GRP’s installed base has grown from 137MW, comprising two assets (windfarms in the South of Ireland) in March 2017 to 32 assets, along with an 11MW co-located battery storage project, with an aggregate net installed capacity of 1,095MW as at end-June 2022.

The Group has expanded beyond its home market of Ireland, with in-place wind farms in France, Germany, Spain, Finland and Sweden. It has also expanded beyond wind, moving into the aforementioned battery storage space and it has also agreed to acquire solar assets in Spain and Ireland.

At the end of June GRP had forward purchasing agreements to add 330MW to its platform, which will grow capacity to 1,426MW by the end of 2023.

This diversification has clear benefits. At the simplest level, the wind doesn’t always blow in Ireland, so having a geographic spread of assets makes sense. Given that this is a highly regulated space, it also makes sense to be exposed to different jurisdictions to mitigate risks from any adverse regulatory or tax changes. Battery storage has obvious structural growth characteristics as grids adapt to higher weightings of renewable capacity, while adding solar expertise further augments what I suspect is GRP’s attraction to developers as a ‘preferred bidder’ (strongly capitalised, proven track record of M&A) for European renewable assets.

In October the Group held an EGM to refine its investment policy. In summary, GRP’s growth framework is now: (i) To invest in operational renewable electricity generation assets in ‘relevant countries’ (Ireland, Belgium, Finland, France, Germany, Netherlands, Denmark, Norway, Sweden, Spain and Portugal) “where the Board and the Investment Manager believe there is a stable and robust renewable energy policy framework”; (ii) To achieve diversification through investing across a number of geographies and renewable energy technologies; (iii) Openness to owning 100% or less of individual assets; (iv) To use third parties to operate these assets; (v) To cap single investments at less than 30% of GRP’s Gross Asset Value; and (vi) To limit Aggregate Group Debt to 60% of Gross Asset Value (with 40% expected as the typical medium-to-longer term level).

I mentioned earlier the risks for operators of generating assets arising from regulatory or taxation changes. At the end of June approximately 70% of GRP’s portfolio cashflows were underpinned by government support mechanisms with underlying contracted tariffs that are inflation-linked to 2032. Clearly, the cost of living crisis is at the top of the political agenda in all of GRP’s end-markets. I don’t have a crystal ball, but there is plainly a risk that policymakers target the beneficiaries of increased energy prices.

Three important counters to this view are: (i) The decarbonisation agenda isn’t going to go away, so hammering renewable electricity generators isn’t going to attract the billions in investment needed to deliver it; (ii) the market appears to foresee a normalisation in electricity prices, with consensus revenue for GRP in 2023 (€175m) and 2024 (€163m) below the expected 2022 outturn of €216m, notwithstanding the strong growth in GRP’s installed capacity over the next 12 months or so; and (iii) expected annual dividends over 2022-2025 are covered by between 1.3x and 1.9x by expected statutory earnings (and presumably more by expected operating cashflows when you add back the non-cash depreciation charge).

On 1 November GRP released an end-September NAV and dividend update.

From a balance sheet standpoint, the key points are aggregate group debt of €847.5m; Gross Asset Value of €2.1bn (giving a debt / GAV ratio of 40%, in-line with medium-to-long term guidance); and a NAV of 110.1c. The Group’s debt is 100% fixed rate, with a blended rate of just 2.2%.

This NAV was flat on the end-June outturn (also 110.1c) with the moving parts during Q3 being a 5c tailwind from power price and short-term inflation assumptions offset by a 5c hit from an increased discount rate of 6.7% (on an unlevered basis), reflecting the market environment.

How do I view GRP here?

As I said earlier, the decarbonisation agenda isn’t going to go away. Don’t get me wrong – I believe that there will also be a place for non-renewable assets for a long time to come, but the economics of modern renewable assets (essentially zero marginal cost, and this is before taking externalities such as pollution into account) are very attractive. GRP has established itself as a leading owner of European renewable assets, with a clear appetite to do more. Its installed asset base has grown tenfold from 137MW in early 2017 to an expected 1,400MW+ by the end of next year.

Investible assets will continue to grow over time and, by extension, this will see a continued flow of money into the renewable space (on top of that, we are presumably likely to see asset managers being mandated to allocate more to this sector). If GRP continues to trade at/above NAV, I think it’s fair to assume that it can execute on further capital raisings and grow its capacity, with all that this means for future cash flow generation (and dividends). Sure, the nominal cost of borrowing has gone up, but in real terms debt is still cheap.

How does the market view GRP?

On Friday 4 November GRP closed at €1.14 in Dublin (its shares are listed on Euronext Dublin and on the AIM in London). The Dividend Discount Model holds that P = D1 / (r-g), where P = the current share price; D1 = the value of dividends at the end of the first period; r = the cost of equity for the company; and g = the expected constant growth rate in perpetuity expected for the dividends.

We already know that the share price is €1.14 and that GRP will pay a dividend of 6.18c for the current financial year. For g, I think it is fair to assume that GRP’s income will, all else being equal, track expected inflation. Most of GRP’s assets are located in the Eurozone, where the ECB’s mandate is to maintain price stability, which the ECB defines as 2% inflation over the medium term.

We can then update the Dividend Discount Model from P = D1 / (r-g) to €1.14 = 6.18c / (r – 2%) and use this to solve for the cost of equity that is currently being priced in by the market. This shows that the market is currently pricing in a COE of 7.42% for Greencoat, which feels a bit like Goldilocks (not too hot and not too cold) to me.

Data from Marketscreener suggest that the average price target for the 8 analysts who follow GRP is €1.37, with a range of €1.26 – €1.50. I suspect many of those targets were set before the recent spike in interest rates, which has pumped up the risk free rate. By this I mean that the €1.26 low end of the sell side price target range provides a dividend yield of 4.9% (off the 6.18c/share targeted for this year) while the high (€1.50) end pays you a 4.1% yield. At Friday’s closing price of €1.14 the dividend yield on GRP is 5.4%.

By way of comparison, the Irish 10 year yield is 2.8%, the UK 10 year is 3.5% and the US 10 year is 4.1%. The Stoxx 600 is on a trailing 12 month yield of 3.1%. Plainly, investors are not going to bid GRP up to silly levels if they can pick up similar risk free / less risky cashflows elsewhere.

But at 5.4%, nearly double the Irish 10 year yield and 1.7x the trailing yield on the Stoxx 600, the yield on GRP here certainly looks attractive. Furthermore, and acknowledging: (i) policy risks arising from the inflationary backdrop; and (ii) likely higher future borrowing costs, the growth to come from forward-purchase agreements to acquire energy assets and beyond (GRP guides that it has >€0.4bn of investment capacity post the closing of the forward-purchase agreements gives me comfort that GRP can grow its distributions from the current level.  

Overall, I like Greencoat Renewables and am a happy shareholder.

If you liked this blog, then why not consider subscribing by adding your email address to the box below?

Abrdn (ABDN LN) – Disemvowelled?

In 2017 the Boards of Standard Life and Aberdeen Asset Management announced that they had reached agreement on an all-share merger of the two businesses.

At the time the combined Group’s leadership heralded the “compelling strategic and financial rationale” of the merger, saying that they believed it would: (i) Harness complementary market-leading investment and savings capabilities”; (ii) Reinforce both entities’ long-standing commitment to active management, underpinned by fundamental research; (iii) Establish one of the largest and most sophisticated investment solutions offerings globally; (iv) Create an investment group with strong brands, leading institutional and wholesale distribution franchises, market leading platforms and access to long-standing strategic partnerships; (v) Bring scale; (vi) Deliver through increased diversification an enhanced revenue, cash flow and earning profile; and (vii) Result in material earnings accretion.

A presentation in August 2017 (marking the completion of the merger) titled: “Creating a Diversified World-Class Investment Company” further set out the Standard Life Aberdeen proposition. Management saw clear benefits across distribution (50 offices with customers across 80 countries), augmented by minimal client overlap; breadth and depth of talent with more than 1,000 investment professionals; scale to invest in proposition; and financial benefits. The Group targeted £200m of synergies from the merger. At the time of the presentation Standard Life Aberdeen reported AUM of £583bn, broken down as follows: Equities £159bn; Fixed Income £181bn; Solutions (Absolute Return, Quant, Multi-Asset etc.) £180bn; and Real Estate & Private Markets of £63bn, and AUA of £670bn.

The shares closed at 493p the day before (i.e. 13 August 2017) that presentation. On 14 October 2022 the shares closed at c.140p.

As implied by the share price performance, the merged Group has had a bumpy first five years. In FY 2018, its first full year post-merger, it took an £880m goodwill impairment charge, “based on the prevailing market conditions”. This was followed by another impairment charge of £1,569m in FY 2019, reflecting: “the impact of 2019 net outflows, market conditions and competitive pricing on future revenue projections and excludes expected significant benefits from planned future expense savings”. In FY 2020 the Group booked another impairment charge, this time of £915m, attributed to “the impact on reported revenue and future revenue projections of global equity market falls and a change in mix with a higher proportion of lower margin assets”. Following that write-down, the asset management goodwill is now fully impaired.

Administration charges, excluding restructuring and impairments, were £1,746m in FY 2018. This had improved to £1,198m in FY 2021, although the benefits from this were overshadowed by net operating revenue also having contracted (from £2,131m to £1,543m) over the same period. Abrdn’s AUMA at end-H1 2022 was £508bn.

What is management doing to arrest these trends?

As I see it, there are three distinct strategic actions – new lines, costs and shedding non-core assets.

On new lines, there have been three interesting acquisitions by the Group. In December 2020 the Group took a 60% stake in the leading logistics real estate manager, Tritax, to strengthen its property offering. Tritax’s AUM has grown since then from £5bn to £7.7bn (as at end-June 2022). In May 2022 the Group closed the £1.5bn acquisition of ii (interactive investor) which was an excellent use of surplus regulatory capital (which had stood at £1.8bn at end-2021). ii has a really strong franchise, with £55bn of AUMA (more than a tenth of the Group total) at end-June; a 20% market share with over 400,000 customers who have average AUA of £145k. In addition, on 29 October 2021, Abrdn purchased 100% of the issued share capital of the investing insights platform Finimize.

With a H1 2022 cost/income ratio of 83%, it is no surprise that costs are a key focus for management. The previous target of a 70% C/I ratio by the end of 2023 has been vacated, but given the delta between earnings and the dividend – and the extent to which revenues are beyond management’s control – costs are the primary area where management can ‘control the controllables’.

Management is targeting net cost savings of £75m by 2024 from: (i) Fund rationalisation, with c.110 of ABDN’s 550 funds targeted for merger or closure; (ii) Equity and multi-asset solutions transformation; (iii) Non-core disposals; (iv) Single middle office operating model; and (v) Management de-layering.

The Group has been monetising non-core stakes in two Indian associated businesses. In September, ABDN sold £262m worth of shares in HDFC Life Insurance Company. The previous month it sold off £225m of shares in the HDFC Asset Management Company. ABDN still has a 1.66% stake in HDFC Life Insurance Company and owns 10.21% of HDFC Asset Management Company.

By my maths, the market value of ABDN’s stake in HDFC AMC is £449m, while its stake in HDFC Life is worth £202m. ABDN also owns 10.4% of the UK listed Phoenix Group, with that stake worth c.£550m.

These interests in other listed companies complicate the ABDN investment story. The combined value of those shareholdings is £1.2bn, or 40% of the ABDN market cap. Management guide that they will continue to monetise the Indian stakes, which will make the story a little simpler.

Apart from simplification, there is another key angle to the disposals. These are important when considering shareholder distributions.

The Group’s dividend policy is “set at the level of 14.6p per annum until it is covered at least 1.5 times by adjusted capital generation, with the objective of growing the dividend in line with [the Board’s] assessment of the medium term growth in profitability”. Bloomberg consensus doesn’t see earnings climbing above 14.6p until 2025, however. Sure, earnings is not (I stress) the same as ABDN’s measure of adjusted capital generation, but optically EPS < DPS isn’t a good look.  

Complicating the picture further, in July the Group announced the commencement of a programme to return £300m to shareholders through share buybacks, starting with a first phase of up to £150m (which will run to no later than the calendar year end).

The collapse in the ABDN share price means that the stock now yields a little more than 10%, so either the market has this wrong and the stock is a buy for investors looking for high income, or there’s a risk that the dividend will be cut, or something else entirely. Which is it?

There are a couple of moving parts here. Taking disclosures on total voting rights, the Group had 2.2bn shares in issue at the start of this year, implying an annual cash dividend cost of £318m on the basis of the 14.6p dividend guidance.

By the end of September, the share buyback programme has pared the share count by 58m shares, saving £8.5m a year in dividends. A back of the envelope calculation suggests that ABDN was about two-thirds of the way through the initial tranche of £150m by end-September, so that implies savings once the first tranche concludes of c.£13m. Let’s double that for the second £150m and (very crudely) you knock about £25m a year off the annualised dividend.

So, the pro-forma dividend cost is £293m. Bloomberg consensus, shown below, gives net income of £179m for 2023 and £237m for 2024. Combined earnings of £416m for the two years which very simplistically implies a notional ‘gap’ of £171m (again, this is based off statutory earnings – ABDN uses adjusted capital generation as its key metric here) that needs to be solved for from (say) reserves or through ongoing divestments of the Indian investments that the Group holds.

Sure, I’m keeping things very simple here and disregarding all of the other moving parts when it comes to regulatory capital. But it is noteworthy that ABDN had a regulatory capital surplus of £0.6bn at end-June 2022, so – assuming the analyst consensus is close to the mark – this £0.6bn surplus can cover the notional £171m uncovered (I stress that this is on my numbers, calculated on the basis of statutory earnings minus pro-forma dividends, and ignoring everything else, including ABDN’s own approach to calculating capital generation) dividends for 2023 and 2024 (i.e. up to 2025, when earnings are forecast to more than cover the dividend) and also close out the remaining part of the £300m share buyback programme.

In short, barring any major unforeseen shocks, I’m comfortable about the outlook for the dividend.

So what is my take when it comes to ABDN?

For starters, as someone who bought the stock in November 2021, I’ve been ‘long and wrong’. Market performance has dragged down virtually all asset managers. But when the market turns, asset managers like ABDN should outperform given how geared they are to market performance.

There are a number of turn-offs in the ABDN story that management will need to address. Firstly, it’s complicated. As I mentioned, 40% of its market cap relates to shareholdings in other plcs. That will reduce over time, however, as management intends to sell off the two listed Indian investments. Secondly, the cost / income ratio at 83% is way too high. Shrinking the fund count from 550 funds to c.440 funds is a good start, but I question whether the Group really needs to offer a menu of 440 funds to investors. There might be deeper cuts to come. Thirdly, management needs to arrest the declining trend in AUMA – that task won’t be helped by the rationalisation of funds in the short term, as this is likely to involve some leakages. Fourthly, the dividend. For the reasons I’ve set out above, my hunch is that it’s safe. Bloomberg consensus suggests that most analysts agree with me on the dividend – sure, the consensus is 14.6p for 2022, 14.3p for 2023, 14.2p for 2024 and 14.6p for 2025 – the latter being the year in which earnings will rise above the target DPS. But within the 2023 and 2024 ‘consensus’ there’s clearly a lot of analysts penciling in 14.6p (i.e. flat dividends) as surely nobody is expecting near-term dividend growth given the market backdrop.

All in all, my instinct is to stick with ABDN. It is throwing off a good dividend – which will compensate my patience, it has made some canny acquisitions and it has a strong distribution network that leaves it well placed when the eventual upturn comes. However, I don’t see a need to top up the position in it (or indeed any of my other asset manager plays) just yet. There’s just too much uncertainty in the global markets at this time.

If you liked this blog, then why not consider subscribing to it by entering your details into the box below?

EEP (EEP LN) / SPDI (SPDI LN) – The Alchemists

I have a little under 1% of my portfolio in two Eastern Europe focused property groups, who are now, broadly speaking, following the same strategy – namely, the realisation of their real estate assets. Secure Property Development & Investment is a London listed (ticker SPDI) microcap that was originally established to invest in opportunities in Ukraine, ended up pivoting into having a portfolio across four countries (Greece, Romania, Bulgaria and Ukraine) and which since 2018 has been focused on transferring core property assets in exchange for shares in a larger Dutch listed fund (Arcona, ticker ARCPF) and selling non-core assets for cash. Management guide that within a year or so, shareholders in SPDI will be left with cash and Arcona shares. While there are, obviously, idiosyncratic risks in investing in Eastern European markets, even under a bear case scenario I see the prospect of good upside here relative to the current share price.

A previously London listed (ticker EEP) but now privately held company is Eastern European Property Fund Limited. That listed shortly before the GFC with the intention to invest in a number of South-East European countries but two years after listing it was buying back its own stock. A programme of disposals has reduced the business to a single property (+cash) play.

Put another way, one goal of alchemy was the transmutation of base substances into gold. Management at SPDI and EEP are engaged in converting legacy real estate holdings into more liquid assets. My lessons from holding these two are threefold – (i) realisation strategies can take an inordinate amount of time to execute, especially if external factors come to bear; (ii) concentration matters as much as scale when it comes to real estate – it’s one thing having a portfolio worth X, but another thing if X is spread across multiple markets; and (iii) the margin of safety offered by buying at a sharp discount to the underlying value comes into its own when extraordinary external events – global pandemics, regional wars, financial and political crises – impact the markets in which your positions operate.

SPDI – Bull, base or bear?

On 1 August 2007 Aisi Realty (as Secure Property Development & Investment was then called) was admitted to trading on the London Stock Exchange. The release accompanying this news said that it intended to be “a closed-end investment company focusing on investments in the real estate market in Ukraine”. The Group raised c.$33m through a placing of 50m shares at 66c/share, leaving it with an opening market cap of US$110m after taking non-placing shares into account. Its major shareholders at the time were Lansdowne, MacArthur Foundation, Trafelet, Hansa Investeerimisfondid, Tudor, Fidelity and Woodbourne. Aisi had originally been established in 2005, and pre-IPO had committed over US$30m to the acquisition and advancement of six real estate projects.

Timing is everything, and the Global Financial Crisis would soon weigh on performance. At end-2007 the Group had net assets of $100m / US70c a share, but this had reduced to $84m / US43c a share by end-2008. Worse was to come. By the end of 2009 net assets had fallen to $51m and the FY results statement said that: “Considering the current market conditions, the Board of Directors has decided to focus the strategy of the Group away from speculative development to investing in income generating assets. The focus will now be on warehouses and big box retail, with well-established international tenants with long term leases. We have built a strong pipeline of potential new investments”. By the end of 2010 NAV had plunged to $26m or US6c a share. In 2011 new shareholders and a new CEO (Lambros Anagnostopoulos, still in situ) were brought in. Their investment of $8m helped to arrest the downward trend in NAV, which finished 2011 at $33m. The new management team pledged to diversify the Group’s asset base to include other Eastern European markets and reduce its exposure to developments from 100% to c.50%. At the end of 2011 Aisi’s portfolio comprised a 45% leased logistics park outside of Kyiv and four development sites in Odessa, Kyiv (x2) and Zaporozhye. NAV improved to $35m by end-2012.

2013 was a pivotal year for the Group. It changed its name (from Aisi to Secure Property Development & Investment, or SPDI) and raised $17m at a placing price of 74p/share. This pushed NAV up to $53m.

In March 2014 the Group announced the acquisition of the Innovations logistics park in Bucharest, its first deal outside of Ukraine, for €12.6m. This was followed in August 2014 by the purchase of a warehouse in Athens for an EV of €15m; a €6m purchase of a Bucharest office building (EOS) in the same month; and a portfolio of 122 apartments in Bucharest with a NAV of €3.3m in September 2014.

The Group also secured more external funding, with a $1.3m placing in November 2014 and €8m proceeds from an open offer in March 2015. In April 2015 the Group paid €4m for a 20% stake in an office building in Sofia, Bulgaria, expanding the portfolio to four countries. In May 2015 it announced £16.5m of purchases comprising a DIY retail property in Craiova (Romania), a 24% interest in the Delea Nuova office building in Bucharest and a portfolio of residential assets in Sofia and Bucharest.

The FY 2014 accounts were presented in euro and these showed a decline in the NAV to €32.6m from end-2013’s €37.7m, driven by Ukrainian political turmoil and the illegal annexation of Crimea by Russia. FY 2015 brought better news, with NAV rising to €42.4m.

The FY 2015 results in mid-2016 were what brought SPDI to my attention. The shares were languishing at a 63% discount to the end-2015 NAV and management commentary suggested the recycling of capital from non-income producing development assets into high yielding income plays in fast growing Eastern European countries. At the same time the Group announced the sale of its large Kyiv logistics warehouse (Terminal Brovary) for $16m, representing a €2.7m gain on disposal. This strategy yielded encouraging early results, with the FY 2016 results showing an improved operating performance, although NAV (adjusted for minorities) slipped back to €39m.  

In early 2017 the disposal of non-core assets looked like it was gathering pace. Agreement to sell the Kiyanovski site in Kyiv for >$3m was announced in July 2017, while in the same month a landbank in Bucharest was sold for €3m. In February 2018 SPDI said it had sold €1m of Romanian and Bulgarian residential properties. EBITDA increased by 61% in FY 2017 (to €3.7m), but NAV slipped back again to €36m.

2018 was the year in which everything changed for SPDI. Most significantly, in December of that year the Group announced that it was exchanging most of its property assets for shares in the larger Dutch listed Arcona Property Fund. This seemed like an excellent value creation catalyst, pushing SPDI’s core portfolio into a larger scale (and dividend paying) Eastern European property specialist. The Group separately agreed the disposal of its Greek logistics asset for an enterprise value of €12.5m and the sale of the Craiova DIY premises for €2.5m in cash.

The Group’s audited 2018 results show total assets of €86m and net assets attributable to shareholders of €36m. At end-2018 SPDI had economic ownership of five income producing commercial property assets (Victini, Greece; and EOS, Delenco, Innovations Logistics Park, Kindergarten – all Bucharest); land plots in Ukraine (5x), Romania and Bulgaria; and 118 residential properties across five schemes in Sofia and Bucharest.

The FY 2021 results were released on 30 June 2022. What’s changed? Total assets as at end-2021 were down to €53m and NAV attributable to shareholders had reduced to €29m. Of the above mentioned assets, Victini was sold to a third party in 2019. The EOS and Delenco buildings were transferred to Arcona in 2022. Of the land bank, two of the Ukrainian and the Bulgarian assets have been transferred to Arcona. The residential portfolio has been reduced to just 11 properties as of end-2021 due to a combination of third party disposals and the Boyana asset in Sofia transferring to Arcona.

The asset side of the pro-forma SPDI balance sheet now mainly comprises two Bucharest commercial properties (a logistics park and international school), three Ukrainian land plots and a land plot in Bucharest, the 11 residential units, cash of €2m and 1.1m shares (and additional warrants) in Arcona, valued at c.€7m at the current Arcona share price of €6.25/share. To me it seems likely that the remaining residential properties will be monetised in the near term. The Ukrainian land plots are clearly impossible to value in the current market – their carrying amount at end-2021 was €3.6m or 16% of the attributable net assets. Taking the basic accounting principle of valuing assets at the lower of cost or net realisable value and the current situation, let’s prudently apply a zero value to the Ukrainian plots – ceteris paribus, that reduces the end-2021 NAV per share from 18c to 15c / 12.8p. I am agnostic about whether or not the remaining land and commercial property assets go to Arcona or if they are sold for cash.

As of end-2021 the liability side of the SPDI balance sheet was mainly comprised of loans tied to the property assets; €3m of bonds and other debt and €5m of assorted payables and provisions. One thing to call out here is that the provisions include €2.5m in relation to a lawsuit filed against SPDI by Bluehouse Accession Properties Holdings III SARL, which originally sought €7.5m. SPDI management says it: “believes the Company has good grounds of defence and valid arguments and the amount already provided is adequate to cover an eventual final settlement between the parties” but clearly there is a not immaterial downside risk here.

What is the end game for SPDI? As the CEO puts it in the 2021 results statement in June: “2022 is expected to be the last year of SPDI operations as we know them with its net assets turned into APF [Arcona Property Fund] shares and cash, within the year or soon after, and opex being reduced to mostly listing and legal related costs. When such APF shares and cash are distributed to our shareholders they will be able to either monetise their investment by selling them or retain them and follow APF’s growth into a dividend issuing pan-East Europe property company, the preferred way of safeguarding their investment value together with having the option of further value generation. Management and directors of SPDI are committed to see a swift conclusion of the transaction, so that they will ensure the transformation of our Company”.

So, the valuation case for SPDI rests on the extent to which management can convert the residual assets to cash (or Arcona shares) and discharge liabilities as envisaged.

Pulling it all together, there are three valuation scenarios that I can see for SPDI – base, bull and bear.

The bull case is to simply take the end-2021 NAV of 18c / 15p a share.

The base case is to zero the Ukrainian assets which moves the pro-forma NAV to 15c / 12.8p a share.

The bear case is to zero the Ukrainian assets and assume a further €5m hit from the Bluehouse case. That gets you to a NAV of 11c / 9.5p a share, although there are obviously other risks (What if €5m isn’t enough of a downside? What will rising interest rates do to real estate markets? What are Arcona’s prospects?) that should not be overlooked or ignored. In the interest of balance though, the Arcona share price of €6.25 is well below Arcona’s latest NAV of €11.88, so there’s potentially €5m+ of upside (applicable to all three scenarios) if Arcona’s discount to NAV is eliminated.

As of 12 August, SPDI’s share price was just 6.25p, well below even my illustrative bear case.

EEP – Turkish delight?

In March 2006 management at Eastern European Property Fund Limited (EEP) announced that a placing by Collins Stewart had raised gross proceeds of £20m at £1/share, with all shares admitted to trading on the LSE’s AIM market. Its stated investment objective at the time was “to provide shareholders with a high level of income and potential for significant capital growth by investing in property in the major urban areas of Turkey, Romania, Ukraine and Bulgaria”. Difficult financial market conditions (GFC) undoubtedly weighed on the Group’s performance in the years since IPO, with the shares soon trading at a sharp discount to NAV (at end-September 2006, the Group’s maiden interim results period, the shares were on a 3.7% premium to NAV, but by the March 2007 FY results the shares were at a discount of 12.3% to NAV and this would worsen to a 17% discount by the time of the September 2007 interims). Doubtless mindful of the discount, the Group repurchased 4.4m shares (a fifth of its opening share count) between May 2008 and May 2014 for a cumulative £3.3m or 74p/share.

Fast forward to 19 September 2017 when the Group released its H1 2017 results. These showed a portfolio that had been reduced to just two properties – an office building (The Atrium) in Sofia and the multi-use Markiz Passage building in the fashionable Istiklal Avenue in Istanbul. NAV at end-June 2017 was just 79.68p, a poor return for a company that listed 11 years earlier at 100p a share. In November 2017 management announced that it was launching a strategic review, for which it would consult with shareholders. The following month management said it had “determined to move forward with proposals to de-list the Company in due course”. The shares delisted in early 2018, with many shareholders (including this one) remaining on the register. Management has sought to minimise OpEx while progressing the sale of its remaining assets. In 2018 OpEx was £640k; in 2019 £391k; in 2020 £299k; and in 2021 £201k. In 2020 The Atrium was sold at a modest premium to its book value. This has left the Group with a healthy liquidity position – enough to cover many years of OpEx (so putting EEP in a strong negotiating position when negotiating with bidders on the remaining asset) and/or invest in a major upgrade to the Markiz building to enhance its value. Wars in two neighbouring countries, a global pandemic and Turkey’s unusual economic and political policies have undoubtedly weighed on the NAV, which sits lower than it did at the time of the delisting (for obvious reasons I won’t cite the end-2021 NAV here). Nonetheless, the ‘clean’ nature of EEP’s accounts (mostly Markiz and cash on the asset side of the balance sheet; mostly shareholders’ funds on the other side of the balance sheet – EEP has no bank borrowings) means that a satisfactory bid for the remaining property asset would open the door to a prompt distribution to shareholders.

Haleon (HLN LN) – A Haleon Cure

Introduction

On Monday 18 July trading in shares in Haleon (HLN) will commence on the London Stock Exchange (ADRs will also be listed on the NYSE). This marks the culmination of a long-running effort to separate GSK’s Consumer Healthcare business from the rest of GSK. The IPO was nearly derailed by third party bid interest in the business, which sets a useful reference point in terms of valuation. In this piece I’ll discuss what Haleon offers to investors, its background, prospects and conclude with some thoughts on valuation.

Background to the IPO

On 23 June 2021 GSK confirmed its intention to separate its consumer healthcare business into an independent listed company. The separation will be effected by way of a spin-out of at least 80% of GSK’s 68% holding in the business to GSK shareholders, who will receive the same number of shares in Haleon as they currently hold in GSK. The other 32% is currently held by Pfizer. GSK shareholders approved the demerger at an EGM on 6 July. Prior to the IPO a dividend of £11bn is to be paid by Haleon to GSK and Pfizer.

Following the demerger, the share register will look like this: 54.5% held by GSK shareholders; 6% held by GSK directly; 32% by Pfizer and 7.5% will be held by Scottish limited partnerships (SLPs) linked to GSK’s UK pension schemes. GSK says that it “intends to monetise its holding in Haleon in a disciplined manner” and, in relation to the SLPs, GSK will also have the ability to monetise these, although there is an implicit hurdle to a sale in that proceeds up to £1.08bn are ring-fenced to fund pension deficits. For its part, “Pfizer intends to exit its 32% ownership interest in Haleon in a disciplined manner”. So at least 38% of the share register will be ‘loose’, with the prospect of a further 7.5% to come from the SLPs should GSK decide to sell, plus whichever of the 54.5% of current GSK shareholders are disinclined to hold Haleon within their portfolios.

What is Haleon?

To quote GSK: “Haleon is a new world-leader in consumer healthcare with a clear strategy to outperform and run a responsible business. For prospective investors, it will offer an exceptional and focused portfolio of category-leading brands with an attractive footprint and competitive capabilities; a highly attractive financial profile of above market, medium-term annual organic revenue growth of 4 to 6%, combined with sustainable moderate, adjusted margin expansion on a constant currency basis, with strong cash generation and conversion”.

Haleon has five product categories – Oral Health (28.5% of 2021 revenues); Pain Relief (23.4%); Digestive Health & Other (20.4%); Vitamins, Minerals & Supplements, or VMS (15.7%); and Respiratory Health (11.9%).

It has nine ‘power brands’ – (i) Sensodyne (the world’s leading sensitivity toothpaste and #2 overall toothpaste); Polident (the world’s leading denture care brand); parodontax (one of the world’s fastest growing toothpaste brands); Voltaren (the world’s leading topical pain relief brand); Advil (the world’s #2 systemic pain relief brand); Panadol (the leading systemic pain relief brand in the world ex-US); Theraflu (#2 in Europe and #3 in the US systemic cold and flu brand); Otrivin (the world’s leading nasal decongestant); and Centrum (the world’s leading multivitamin). Other brands include Nicorette, ChapStick and Panadol (Haleon’s manufacturing plant in Dungarvan in Ireland produces six billion Panadol tablets annually!).

Management rationalised the portfolio over 2019-21, selling “approximately 50 non-strategic and growth-dilutive OTC and skincare assets to raise £1.1bn of net proceeds”. As a result of these disposals, the share of revenue accounted for by the nine power brands has grown from 44% in 2015 to 58% in 2021.

Haleon has also streamlined its manufacturing (from 41 locations in 2015 to 24 in 2022), distribution (c.200 warehouses in 2015, 90 in 2022) and R&D (from 9 centres in 2015 to 4 in 2022) footprint.

Haleon has a number 1 or number 2 OTC/VMS presence in countries representing over 70% of the global OTC/VMS markets.

Financial information provided in the prospectus shows some very encouraging trends. Revenue rose from £8.5bn in 2019 to £9.5bn in 2021. Gross margins expanded from 57% in 2019 to 62% last year. And the Group has a strong cash generation profile – net cash from operations was £1.4bn in each of the past two years, representing more than 80% EBIT conversion. Unaudited Q1 (to end-March) 2022 results show continued strong top-line growth (revenues +14% y/y to £2.6bn) and operating leverage, with EBIT rising 34% y/y to £466m. Net assets, adjusting for minority interests, were £26.7bn at end-March, or £15.6bn pro-forma for the pre-IPO dividend payable to Pfizer and GSK. A trading update is due to be released ahead of the publication of HY results in September.

In terms of governance, Haleon will be led by CEO Brian McNamara (CEO of GSK Consumer Healthcare since 2016); CFO Tobias Hestler (CFO of GSK Consumer Healthcare since 2017); and Chairman Sir Dave Lewis (former Tesco CEO).

M&A History

This IPO might never have seen the light of day. In January it emerged that Unilever had made a £50bn approach for the business, but GSK rejected its overtures. In May it was reported that Nestle had considered teaming up with Reckitt for a joint bid for Haleon, although nothing came of this. Apart from trade interest, I suspect that PE firms would also be interested in Haleon given its strong brands and cash generation. These qualities (brands and cash flow) are supportive in terms of valuation – HLN would be a lovely fit for some of its largest peers.  

Prospects

Haleon estimates that its addressable market was worth “over £160bn” in 2021, growing at 3-4% p.a., giving HLN a blended market share of nearly 6%. This leaves plenty of room for expansion both organically and through M&A. There are clear structural drivers for the OTC/VMS market, namely: (i) ageing populations; (ii) expanding middle class populations; (iii) growing self-care; and (iv) premiumisation. Presumably the future will see a higher weighting to digital sales, which is a further tailwind to margins – the prospectus notes that online delivered c.8% of Haleon’s revenue in 2021, up from c.4% in 2019.  

Haleon guides to medium-term organic revenue growth of 4-6% p.a., ahead of the market average. The Group delivered organic (LFL) volume growth of 2.8% in 2020 and 3.8% in 2021 but this growth rate is expected to quicken post-COVID-19.

As discussed above, Haleon management has made impressive progress in consolidating its manufacturing, distribution and R&D footprints, which surely will lead to strong economies of scale arising from top-line progression. The prospectus notes that around a fifth of the £600m of cost synergies from the Pfizer-GSK consumer health merger will be delivered this year, presumably providing a tailwind to earnings.

As part of the pre-separation dividend exercise, GSK Consumer Healthcare issued £10bn of bonds with coupons ranging from 1.25-4.00%. Finance costs (just £19m in 2021) will ratchet higher for 2022 and beyond, reflecting this step-change in net debt.

Haleon has a target dividend range of 30-50% of net earnings, although initial distributions are guided to the lower end of this range.

Valuation thoughts

In the opening section I noted that at least 38% (i.e. Pfizer and GSK’s shareholdings) and potentially up to 45.5% (adding in the SLPs) of the initial share register was going to be ‘loose’. It’s also likely that some of the 54.5% of the rest of the share register (shares held by current GSK shareholders) may also be offered for sale if they don’t wish to retain their stake in the Group. An orderly marketing agreement has been struck between GSK, Pfizer and the SLPs where they will notify each other of planned disposals. A lock-up deed has been entered into by GSK, Pfizer and SLPs meaning that they cannot sell any shares until the earlier of (i) 10 November 2022; or (ii) the release by HLN of a trading update for Q3 (i.e. 3 months to end-September 2022). Nonetheless, with the lock-up expiring in (say) 4 months, this is likely to be viewed by investors as a technical overhang on the stock.

We don’t yet know what valuation HLN will come to the market at. But we do know a few things. Firstly, the pro-forma (for the pre-IPO dividend) shareholders’ funds at end-March 2022 were £15.6bn. The SLPs holding 7.5% are linked to £1.08bn of pension liabilities, implying an absolute minimum (bear case) valuation of £14.4bn on admission. And then we know that Unilever was prepared to pay up to £50bn for the business, so we can view that as a bull case valuation. It would seem reasonable to assume that GSK and Pfizer will seek an enterprise value that is as close to the bull case as possible to avoid shareholder disquiet regarding the rejected Unilever approach.

I built a basic HLN model which assumes topline growth of 4.0% p.a. (the lower end of management guidance); broadly stable margins (so, giving no credit for the operating leverage noted above); a step-up in finance costs to reflect the dividend and a 25% tax rate. I’ve also assumed 9.2bn shares outstanding (as set out in the prospectus). My model seems to be more than a little conservative, for example, it gives the net debt / EBITDA multiple as 4.2x at end-2024, whereas management guides <3x. Nonetheless, I’m happy to err on the side of caution. The model produces long-term average ROE of 6.0%, and plugging in growth (g) of 4.0% (in-line with the low end of management guidance for the top-line) and an assumed cost of equity of 5.0% (which seems reasonable for a globally significant portfolio of household name brands) coincidentally suggests a 2.0x net asset multiple is appropriate. This produces an equity value of £32.8bn to which we add (say) £11bn for net debt, producing an enterprise value of c.£44bn. This is not too far off the £50bn that Unilever offered for the Haleon business – and it is quite clear that Unilever’s bid would have reflected the synergies it expected to extract from combining the Haleon assets with its own operations. Another consideration is that stock markets have become choppier since Unilever reached out to GSK, which makes a £50bn initial enterprise value (market cap + net debt) look far less likely.

As an aside, is a 6.0% ROE too low? Over the past three years Haleon has only produced average ROE of 4.0%. While the dividend payment knocks £11bn off the denominator, the interest costs on the £11bn of borrowings to finance the dividend will also pare the numerator. Interest costs may rise over the coming years as Haleon refinances borrowings, although this may be offset depending on the pace of deleveraging. There is also upside risk from operating leverage if the top-line grows in line with management expectations, although restructuring / IPO costs may dampen performance in the short term. If my ROE of 6.0% proves to be too low then the equity value of £32.8bn should be nudged up, although I’m happy to err on the side of caution given the uncertain macro backdrop.

An equity value of £32.8bn equates to £3.55 a share, on the basis of the 9bn shares quoted in the prospectus (if the share count ultimately proves to be different, then disregard the £3.55 and focus on the absolute equity value). On my very basic model, this suggests (emphasis) a forward (2023) PE of 33x and 1% dividend yield – although it should be stressed that this is a crude model with simplified assumptions based off what’s in the prospectus, as opposed to a sophisticated model that’s been run past the company for their comment. Nonetheless, valuing a portfolio of power brands growing at 4-6% p.a. at 33x next year’s earnings doesn’t seem excessive to me. And, of course, GSK argued that a higher enterprise valuation (the Unilever bid) wasn’t enough for it to sell.

In the short term, the overhang from (at a minimum) Pfizer and GSK stock will likely weigh on the share price, as indeed will a more uncertain macro (and associated market) backdrop. I think that will be reflected in the price that GSK and Pfizer list the business at, while a share sale programme involving one or both of those two will likely hold back the shares until their combined stake falls to a more modest level. This could create a decent opportunity to top-up the position I’ll inherit by virtue of my GSK shareholding in due course. On the other hand, recent events show that the emergence of another takeover bid for HLN cannot be ruled out, and any potential acquirer may run the rule over all of Pfizer’s stake to put themselves in the driving seat from an M&A standpoint. Bringing all of that together, my instinct is that the way to play this one is to hold on to my ‘inherited’ (former GSK) shares in HLN when it lists, and look to top up the position in due course if large shareholder sell-downs weigh on the share price after the expiry of the lock-up arrangements.  

If you found this blog to be of interest, then why not consider subscribing by entering your email address into the subscription box below?

CRH (CRH ID) – The building blocks of value

CRH is a global leader in building materials solutions. Its product mix is 40% infrastructure, 35% residential and 25% non-residential. It has an impressive track record, with 5 year CAGR of 6% in revenue, 11% in EBITDA and 10% in cash generation. Over the longer-term, its compound annual total shareholder return since 1970 has been c.15%.

Over the past number of years the Group has pivoted from base materials to more value added integrated solutions. It offers its customers end-to-end solutions where it marries materials, products and services. This full-service offering makes it easier to secure contracts and, importantly, CRH sees this suite as “increasing barriers to switching” for its customers.

As part of this pivot CRH has engaged in significant portfolio management. Since 2014 it has divested $12bn of assets at an average EBITDA multiple of 11x, while acquiring $18bn of assets at an average multiple of just 8x.

This reshaping has contributed to a meaningful expansion in its EBITDA margin, which is +580bps since 2016 to 2021’s 17.3%.

At an investor day in April, the Group set out the structural drivers of long-term growth for its industry.  It sees the world’s population growing by 2bn people to 2050, with ~70% of this growth being seen in cities. Economic growth will underpin demand across residential, non-residential and infrastructure. Sustainability is a major driver of growth in the years ahead (more of this later). And there is a constant stream of work available for repair, maintenance and improvement of existing assets.

The drive to sustainability is a megatrend that CRH is well positioned for. It invests $1bn every decade on innovation and its product offering is pitched at being “quicker (facilitating faster construction times); cleaner (more circular); better (in terms of efficiency and safety); reliable (longer-lasting and more resilient); and cheaper (more use of offsite manufacturing).

One example of the opportunity in sustainable infrastructure is US water. The US has 2.2m miles of underground pipes with an average age of 45 years. The “ageing and underfunded” systems loses 6bn gallons of treated water per day. I would not be surprised if many other developed nations where the Group has operations (it operates from 3,155 locations in 28 countries across North America, Europe and Asia) have a similar profile, which creates material opportunity for the likes of CRH.

Road infrastructure is hugely important to CRH, which is the #1 road builder in the US. As with other areas, it has moved up the value chain, branching out from aggregates to asphalt (2010) and over time adding mix-design, contracting services, engineering, cement, concrete products, bridge construction, water transportation and culverts. That transition from base materials to a full service offering provides it with a strong competitive positioning. As an aside, road infrastructure may seem like a no-no in today’s ‘green’ world, but it is worth mentioning here that CRH is the #1 “road recycler” in America, recycling 25% of every mile of road currently, with an ambition to grow that to 50% within a decade.

CRH’s track record relative to peers is strong, with clear outperformance in terms of growth between 2018 and 2021 in EBITDA (CRH +35%, peers +24%); margin expansion (CRH +480bps, peers +240bps); and cash generation (CRH +51%, peers +40%).

CRH has a clear capital allocation strategy. Management is guiding c.$30bn of operating cash flow generation over the next five years (up from $17bn in the preceding 5 years), which is a reasonable expectation, in my view, given the meaningful margin expansion and portfolio management discussed above, allied to expectations of ongoing M&A (a hallmark of CRH for decades) and undemanding (2-3% in the US, 1-2% in Europe) organic volume growth assumptions).

So what does CRH expect to do with all this cash? Management aims to continue the share buyback programme which has been running since May 2018 ($3.5bn returned to date) at the $1.2bn per annum run rate (so, $6bn) while growing the dividend (which cost $0.9bn in 2021) at a “single digit %” rate. Let’s assume 5% per annum, which means dividends of $5.25bn over a 5 year period. That means total distributions of $11.25bn while CRH’s market cap is $26.6bn – so 42% of today’s market cap to be returned over 5 years.

And what about the other c.$19bn? This is earmarked to be used for M&A (both bolt-on and platform) along with expansionary capex. Let’s assume that the ROA on this matches the FY 2021 outturn (adjusting CRH’s net income for disposal gains) of c.6% – adding more than $1bn to the bottom line or around $1.50 of additional EPS over 5 years – this compares to FY 2021’s EPS of $3.29. To be clear, this isn’t a forecast, and CRH may elect to divest some businesses (or the economy might weigh on performance). Nonetheless, there aren’t too many heroic assumptions that I see here. At 2021’s EPS of $3.29 CRH is on just 10.3x and on my back of an envelope 2026 EPS of $4.79 the multiple drops to just 7.1x.

In April CRH released a trading update in which it guided that “H1 Group sales, EBITDA & margin expected to be ahead of prior year”. Sure, recent updates from other construction companies might make some wary of this guidance. But even if 2022 (and, presumably 2023) prove to be years to forget for CRH, the long-term building blocks of value are quite evident across residential, non-residential and infrastructure.

In terms of valuation (based on actual analysts’ forecasts!), Koyfin data have CRH trading on a very undemanding multiples of 10.9x PE, 6.2x EV/EBITDA and 1.3x P/B. You would have to go back to the COVID period for the last time CRH has traded on this sort of level. Sure (and at the risk of boring readers to tears), the macro environment has become more uncertain. But the political consensus seems to be that massive investment in infrastructure is required over the coming decades, so fiscal policy should (to my mind) act as a counter-weight to any private sector softening arising from the current economic situation.  

I see CRH here as being at a very undemanding multiple for an industry leader that is throwing off cash which it is using to fund attractive distributions and earnings-enhancing M&A and capex. I’m very happy to have it in my portfolio.

If you found this piece to be of interest, then why not consider subscribing to this blog by entering your address into the box below?

STV (STVG LN) – You’ve got to see this

One discipline I have when it comes to my own investments is that I don’t buy a company unless I’ve plugged all of its financials going back to 2007 (where available) into an Excel spreadsheet. I pick 2007 as the starting point as, for many companies, that represented a peak in performance before the GFC, with the intervening years and all that they have seen – recessions, recoveries, referenda and a round-the-world pandemic – providing plenty of proof points on how the company performs in a range of different economic backdrops. 

For STV, 2007 is also a good starting point because it was the year that the management team started the process of transforming a media conglomerate into a focused broadcaster. That year the Group sold billboard business Primesight, while 2008 saw the Group dispose of Virgin Radio. In 2010 cinema advertising unit Pearl & Dean was offloaded. 

These disposals served to transform the balance sheet. At the end of 2006, STV had net financial liabilities, comprising borrowings and convertible loan stock less cash balances, of £161m. By the end of 2010 these had reduced to £52m. The Group has continued to tip away at this, and at the end of 2021 it had net cash of £0.3m. The Group also has a pension deficit, which I’ll return to later in this piece. 

So what is STV? In 1955 the UK launched Independent Television (known as ITV, but this is not the same as ITV plc) as a commercial network to provide competition to the BBC. ITV was structured as 15 regional franchises. Starting in the 1990s, there was a series of takeovers which by 2004 left ITV in the hands of five players – Granada, Carlton (these two owned all the licences for England, Wales and the Isle of Man), UTV (Northern Ireland), STV (which held both of Scotland’s licences) and Channel Television (Channel Islands). In 2004 Granada and Carlton merged to form ITV plc. This company has gone on to buy out Channel Television (in 2011) and UTV (in 2015). So ITV plc (13 licences) and STV (2 licences) control ‘Channel 3’ in the UK. 

STV has shown itself to be excellent custodians of its broadcasting franchise. In 2015 STV had a 16% audience viewing share in Scotland, similar to ITV plc’s share across its licences. By 2021 STV’s share had climbed to 20.8% while ITV plc’s grew to 18.4% – the widest ‘share gap’ that had ever been recorded between the two. This doesn’t quite capture the dominance of STV in its home market though. BBC doesn’t carry advertising, so it is worth noting that STV’s viewing audience is larger than the next nine largest commercial channels in Scotland (Channel 4, Channel 5, ITV3, E4, Sky Sports Main Event, CBS Reality, ITV2, More4 and Film 4) combined. Put simply, STV is the obvious choice for anyone looking to advertise on TV in Scotland. A proof point worth mentioning here is that in H1 2021, 99.5% (435 out of 437 broadcasts) of commercial audiences in Scotland of more than 500k were on STV, with the other 2 being on Channel 4. 

Dominance in viewing share in the commercial segment has led to strong advertising revenue growth. In 2021 the Group achieved total advertising revenues of £112.6m, +24% y/y. To enhance its offering to advertisers, STV allows companies to target “micro-regions” within Scotland. It sells advertising slots on a Macro (all regions) basis and it also sells slots targeted at West, East, Central (West & East), Aberdeen, Dundee and North (Aberdeen and Dundee). Regional advertising revenue was £17.2m in 2021, +22% y/y and close to management’s target of £20m of annual revenues by 2023.

The Broadcast division had revenue and operating profits of £99.1m and £21.8m in 2021, +22% y/y and +41% y/y respectively. 

STV isn’t just about the traditional broadcasting channel though. It has a strategic objective of growing non-broadcasting profits to >50% of the Group total by 2023. Non-broadcasting activities contributed 28% of profits in 2019 and this proportion had climbed to 36% by 2021. 

Last year’s Digital advertising revenues of £17.8m were +30% y/y, also close to the 2023 target of £20m, while Digital delivered profits of £7.9m, +21% y/y. STV has seen very strong growth in streams (+63% to 115m streams in 2021) and monthly active users (+54% y/y in 2021). More people + watching more + for longer = more revenues from this area. Across the iOS, Apple TV and Android stores the STV Player app has ratings of between 4.3 and 4.7, which compares to 3.5-4.3 for Netflix, 3.4-4.7 for Prime, 4.5-4.6 for Disney and 3.1-4.1 for BBC. That suggests to me that the STV Player can hold its own against its peers, helped by being free to viewers. And the Player is scalable, with 22% of video on demand streams in 2021 being to people based in the UK ex-Scotland, up from 2% in 2020. 

But isn’t everyone watching Netflix and Prime these days? STV’s 2021 results deck shows that in the first 7 weeks of 2022, the average daily audience for Scottish TV channels + BVOD (broadcaster video on demand – e.g. STV Player) ranged from a low of 0.5m at 9am in the day to a peak of 1.6m at 9pm at night. For AVOD (advertising based video on demand – e.g. YouTube) and SVOD (subscription video on demand – e.g. Prime, Netflix) the audience size was <100k at 9am up to a peak of 400k at 9pm. Video advertising spend is skewed (87%) towards broadcast and BVOD, with 9% going to YouTube, 2% to TikTok and 2% to other online. For the 16-34 age group, 67% goes to broadcast and BVOD; 23% to YouTube, 7% to TikTok and c.2% to other online. The latter in particular suggests to me that the broadcast / BVOD channel is seen as a critical way to reach customers, with STV’s dominance in Scotland a further reassurance. Indeed, STV’s peaktime average audience in the first 7 weeks of this year (broadcast + STV Player combined) of 351k was higher than all SVODs and AVODs combined (315k).

The Group also has a Studios business which delivered revenues of £26.6m in 2021, +204% y/y. The Group’s target is for this to grow to £40m by 2023. Studios was modestly profitable (£1.3m of operating profits) last year, but STV notes the largely fixed cost base and ability to scale this business. The unit secured 16 new commissions in 2021 (vs 19 in 2020), 12 returnable series (double the 2020 performance) and 7 returning series (versus 4 in 2020). The division doesn’t just make programmes for itself, it sells to multiple broadcasters (BBC, ITV, discovery+, Dave, Channel 4, Channel 5, Sky Arts etc.). STV has made a number of bolt-on acquisitions in Studios, giving it 9 creative labels (5 wholly owned and minority stakes in the others) and it clearly has the appetite to do more – STV notes that it’s in the top 5% of UK production companies by turnover, and it wants to get into the top 2%. The latter implies growing divisional revenue to £70m+.

The Group has a sizeable pension deficit of £79.4m on a pre-tax basis, and £59.6m net of deferred tax. A recovery plan is in place to close this off by 2030. The Group has paid c.£10m a year into the scheme in each of the past three years and this is very affordable – net operating cashflow, which is after (emphasis) taking the above deduction for the pension into account, has averaged c.£15m a year for the past three years. 

STV’s recent financial performance has been very good. In 2021, adjusted earnings of 45.6p were +32% y/y. On a statutory basis, the Group has posted profits in each of the past 12 years. As mentioned above, the Group moved into a net cash position during 2021. Management says that the net cash position supports its investment plans – it intends to spend £12.5m on a combination of capex, growth (both organic and inorganic) in Studios and digital marketing and content this year.

Despite the macro headwinds, I am optimistic about the prospects for 2022. If people are going to be going out less due to the rising cost of living, this is positive for audience figures. The football World Cup – which Scotland may still qualify for – is being held in Q4 of this year. The 2021 results show that the delayed Euro ‘2020’ championships were a factor in last year’s strong Q2 advertising performance (+82% y/y, but this is flattered by COVID comparatives). The Group has signposted a busy slate of new content dropping this year. Advertising revenues are expected to be +20% y/y in Q1 2022. As per previous custom, I expect a short trading update to accompany the AGM later this week. There may be some cautious language around the macro outlook but (as detailed below) STV isn’t priced for perfection at the current multiple.

Bloomberg consensus (based on the closing price last Thursday, before the Easter break) has STV on a prospective 2023 PE multiple of just 6.5x, which seems an extraordinarily cheap price to me for a company that enjoys a dominant market position in its core broadcasting business; has a credible strategy to grow in Digital and Studios; has a net cash position; and offers an attractive 4.1% dividend yield. Yes, the pension deficit is large but there is a clear and credible plan to close it off by the end of this decade. For me, I think STV is a very attractive business and that is why I have added it to my portfolio today. 

As an aside, within the UK television sector there is a lot of focus on Channel 4 at this time. The British government has signalled its intention to sell it, and while political opposition means that there is a road to travel before its future becomes clear, I am intrigued by the £1.5bn price tag being talked about for the business, which delivered revenues of £934m in 2020. A 1.6x P/Sales multiple for STV would imply a value of £232m, while STV’s current market cap is £146m. As mentioned, STV has net cash of £300k and its net pension deficit is £59.6m. The pro-forma enterprise value for STV is (say) £206m so if it were to match the Channel 4 valuation this would imply a £26m / 18% uplift to the share price. But there are two things that need to be mentioned here. The first is that the pension deficit should (all else being equal) reduce by £10m/year between now and the rest of the decade. That’s £10m of enterprise value switching from the pensioners to the equity holders every year. The second point is that if ITV plc were to buy STV to give it a clean sweep of Channel 3 licences across the UK, the synergies it would enjoy from combining the two businesses would merit an appropriate premium. To be clear, I’m not saying that STV is a takeover target – this is a hypothetical. Leaving aside back of the envelope M&A calculations, the reality is that at the current 6.5x PE multiple one can buy a growing industry leader at what seems to be an anomalously cheap price. I’m a happy holder of STV.